Prognostic Charts
Prognostic Charts portray forecasts of positions and characteristics of pressure patterns, fronts, and precipitation at specific times.
Introduction to Prognostic Charts
- Found at https://aviationweather.gov/adds/progs/.
- Portray forecasts of selected weather conditions at specific times
- The chart is an extension of the day 1 U.S. LLSWPC issued from the same observed data base time
- Displays forecast positions and characteristics of pressure patterns, fronts, and precipitation
- The 36 and 48-Hour Prognostic Chart is a day 2 forecast of general weather for the conterminous United States
Prognostic Charts Key Highlights
- Prognostic charts provide forecast depictions of expected weather conditions over specific future time periods.
- Pilots use prognostic charts to evaluate forecast pressure systems, fronts, precipitation, turbulence, icing, and significant weather areas.
- Low-level significant weather prognostic charts help pilots assess hazards affecting general aviation and lower-altitude flight operations.
- Surface prognostic charts show forecast positions of fronts, pressure systems, precipitation areas, and broad weather patterns.
- Prognostic charts support strategic flight planning by showing how weather systems are expected to move and develop.
- Pilots should compare prognostic charts with METARs, TAFs, radar imagery, satellite data, and weather advisories for complete analysis.
- Forecast validity times are essential because prognostic charts represent expected conditions at specific forecast periods.
- Weather systems may develop differently than forecast, requiring pilots to monitor updated weather information before and during flight.
- Proper interpretation of symbols, valid times, and hazard areas improves route planning and alternate selection.
- Understanding prognostic charts improves weather interpretation, aeronautical decision-making, and overall flight safety.
Aviation Weather Prognostic Charts
-
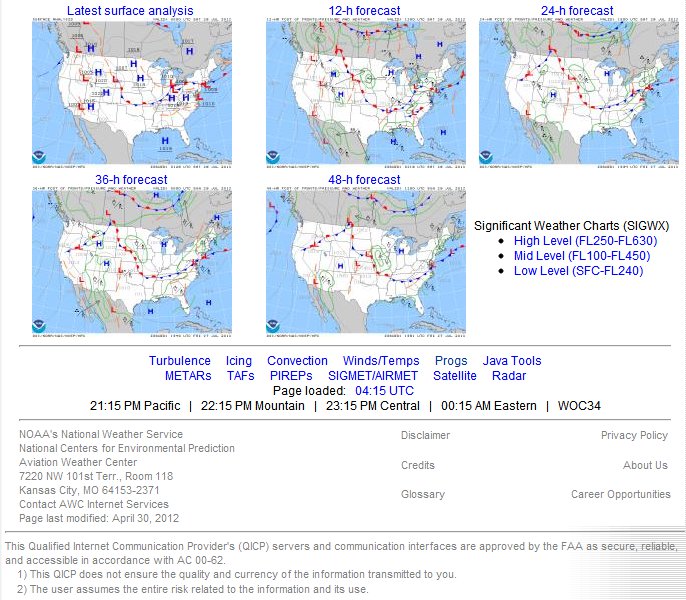
Aviation Weather Prognostic Charts - Aviation Weather Prognostic Charts provide relatively long-term weather forecasts on a large scale to enable future flight planning
Issuance & Validity
- Issued four times daily (00Z, 06Z, 12Z, 18Z)
- Valid for the time specified (12, 24, 36, 48 hrs)
- Data is forecasted
- Information is insufficient for flight planning
- An effective overview of observed and prognostic charts allow the many essential details to fit into place and have continuity
Low-Level Significant Weather Prognostic Chart
- LLSWPC in a day 1 forecast of significant weather in the conterminous United States
- Provides information from the surface to FL240 (400 mbs)
- Altitudes from the surface to 17,999 are referenced using MSL altitudes
- Altitudes from 18,000' to FL240 are referenced using pressure altitude
- Provided in two forecasts, 12 and 24 hours in 4 panels
- Two top panels depict the 12 and 24 hour produced at the Aviation Weather Center (AWC) in Kansas City, Missouri
- Two lower panels depict the 12 and 24 hour produced at the Hydro meteorological Prediction Center (HPC) in Camp Springs, Maryland
High-Level Significant Weather Prognostic Chart
- HLSWPC is a day 1 forecast of significant weather in the conterminous United States
- Provides information from 24,000' to 60,000'
- Covers much of the Northern Hemisphere and a limited portion of the Southern Hemisphere
- Each section covers a specific area and areas sometimes overlap
- Conditions routinely appearing on the chart are jet streams, cumulonimbus clouds, turbulence, and Tropopause heights
- Surface fronts are included to add perspective
- Sometimes tropical cyclones, squall lines, volcanic eruption sites, sandstorms, and dust storms will appear
Surface Pressure Systems
- Depict pressure centers, troughs and on selected panels, isobars
- High and Lows identified by "Hs" and "Ls" respectively
- Pressure troughs are identified by long dashed lines labeled "TROF"
- Isobars are drawn as solid lines to portray pressure patterns
- Isobars are drawn in 8 millibar (mb) intervals instead of 4 mb to provide a less sensitive analysis
- Occasionally, nonstandard isobars will be drawn using 4 mb intervals to highlight patterns with weak pressure gradients
- Nonstandard isobars are drawn as dashed lines
Fronts
- Surface fronts are depicted on each panel
- Formats used are the standard symbols and three-digit characterization code used on the surface chart
-
Type of Front:
CodeDescriptions0Quasi-stationary at surface2Warm front at surface4Cold front at surface6Occlusion7Instability line -
Intensity of Front:
CodeDescriptions0No specification1Weak, decreasing2Weak, little, or no change3Weak, increasing4Moderate, decreasing5Moderate, little, or no change6Moderate, increasing7Strong, decreasing8Strong, little, or no change9Strong, increasing -
Character of Front:
Code:Descriptions:0No specification5Forming or existence expected6Quasi-stationary7With waves8Diffuse
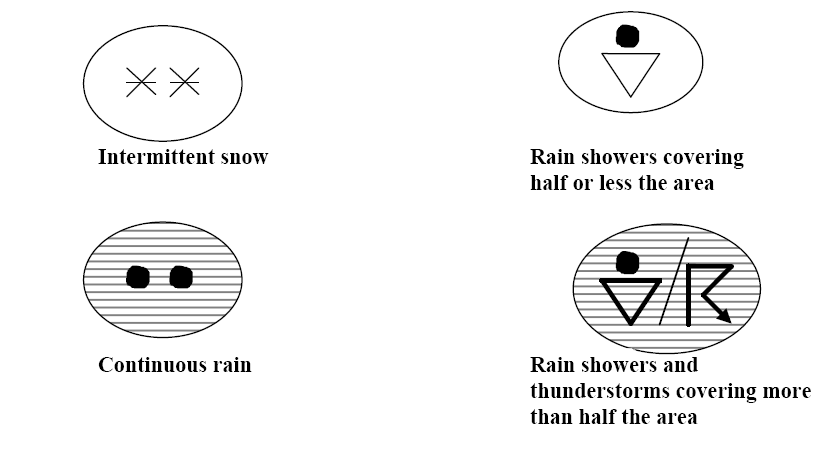
Precipitation
- Solid lines enclose precipitation areas
- Symbols specify the forums and types of precipitation
- A mix is indicated by the use of two pertinent symbols separated by a slash
- Areas of continuous precipitation is shaded as well as precipitation covering more than half of the area
- A bold dashed line is used to separate precipitation with contrasting characteristics
- A dashed line would be used to separate an area of similar characteristics (snow and rain)
Jet Streams
- Jet streams with a maximum speed of more than 80 knots are identified by bold lines
- Arrowheads indicate the orientation of each jet stream
- Double hatched lines identified changes in wind speed
- Speed indicators are drawn at 20-knot intervals and begin with 100 knots
- Standard wind symbol (shaft, pennants, and barbs) is placed at each pertinent position to identify velocity
- The altitude in hundreds of feet prefaced with "FL" is placed adjacent to each wind symbol
Cumulonimbus Clouds
- Cumulonimbus clouds (CBs) are thunderstorm clouds
- Enclosed by scalloped lines
- Isolated or scattered CBs (one-half or less coverage) which are not embedded are not depicted
- Identified with CB and altitude
- Isolated (ISOL)
- Occasional (OCNL)
- Frequent (FRQ)
- Bases that extended below 24,000 are encoded "XXX" (High-Level)
- Thunderstorms imply hazards including turbulence and hail
Tropopause
- Plotted in hundreds of feet
- Heights enclosed by rectangles
- Centers of high and low heights are identified with "H" and "L" respectively with their heights and enclosed by polygons
Weather Flying Categories
- Ceiling and visibility determine the category
- VFR - Visual Flight Rules
- MVFR - Marginal Visual Flight Rules
- IFR - Instrument Flight Rules
- IFR areas are enclosed by solid lines
- MVFR areas are enclosed by scalloped lines
- All other areas are VFR
Freezing Levels
- Depicted by a zigzag line labeled as "SFC" for surface
- Freezing levels aloft are depicted by thin, short dashed lines
- Lines are drawn at 4,000' intervals (80 = 8,000')
- Lines are discontinued where they intersect corresponding altitudes of the Rocky Mountains
- Areas with multiple freezing levels have lines drawn to the highest freezing level
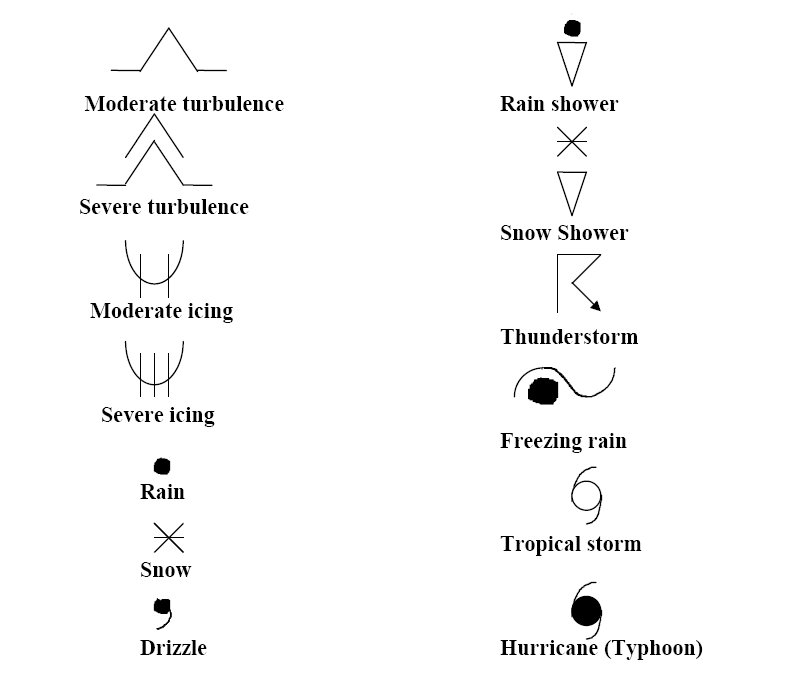
Turbulence
- Areas of moderate or greater turbulence are enclosed by bold, long dashed lines
- Turbulence intensities are identified by symbols
- The vertical extent of turbulence layers are specified by top and base heights
- Areas of thunderstorms do not include indications of turbulence because it is implied
- Added emphasis is included if the turbulence is from the surface to 24,000' or above, having thunderstorms covering more than half of the area
- Intensity symbols and layer altitudes appear within or adjacent to the forecast area
- Heights are pressure altitude
- Bases that extended below 24,000 are encoded "XXX" (High-Level)
Tropical Cyclones
- Positions of hurricanes, typhoons and tropical storms are depicted
- Hurricanes use standard symbol while typhoons are shaded
- When pertinent the name of each storm is positioned adjacent to the symbol
Squall Lines
- Severe squall lines are lines of CBs with 5/8 coverage or greater
- Identified by long dashed lines separated by a V
Volcanic Eruption Sites
- Identified by a trapezoidal symbol
- Dot at the base indicates latitude and longitude of volcano
- Name, latitude, and longitude are noted adjacent
- Reference SIGMETs for more information
Sand and Dust Storms
- Areas of widespread sandstorms and dust storms are labeled by an S
- The S with an arrow depicts areas of widespread sandstorms or dust storms
- The S without an arrow depicts severe sandstorm or dust haze
Prognostic Charts Knowledge Check


Prognostic Charts Conclusion
- For more information, a paper copy of Federal Aviation Administration (FAA-H-8083-28) Aviation Weather Handbook [Amazon] is available for purchase
- A digital copy of Federal Aviation Administration (FAA-H-8083-28) Aviation Weather Handbook is available from the FAA's website
- Improve your weather skills with FAA provided (and WINGS credited) resources by going to https://www.faasafety.gov/ and type "weather" into the search bar
- Still looking for something? Continue searching: