Cruise Performance
Cruise performance determines how efficiently an aircraft travels during the longest phase of flight. Pilots must understand drag relationships, range planning, endurance tradeoffs, and environmental factors affecting fuel and speed.
Introduction to Cruise Performance
- Cruise is the predominant phase of flight by time, making cruise performance one of the most influential factors on the duration and quality of a flight.
- With an appreciation of the drag curve, pilots configure and fly the aircraft to achieve maximum range or maximum endurance.
- Pilots must also consider how various factors impact cruise performance to plan for expected performance.
- Expected conditions necessitate specific actions, such as applying maneuvering speed to cruise.
Cruise Performance Key Highlights
- Cruise performance refers to the aircraft’s efficiency, speed, range, and fuel consumption during level flight operations.
- Cruise altitude selection affects true airspeed, fuel efficiency, engine performance, and aircraft range.
- Higher altitudes generally improve fuel efficiency and true airspeed due to reduced air density and drag.
- Aircraft weight, center of gravity, atmospheric conditions, and configuration directly influence cruise performance.
- Power settings should be selected according to the Pilot’s Operating Handbook (POH) for desired performance and efficiency.
- Leaning the fuel-air mixture properly during cruise can reduce fuel consumption and improve engine efficiency.
- Headwinds and tailwinds significantly affect groundspeed, fuel burn, and overall flight planning calculations.
- Best economy cruise settings maximize range, while best power settings prioritize higher cruise speed.
- Pilots should monitor engine instruments, fuel status, and aircraft systems continuously throughout cruise flight.
- Effective cruise performance management improves operational efficiency, reduces fuel costs, and supports safe aeronautical decision-making.
Understanding the Drag Curve
Maximum Range
- As seen in Figure 5-6, at some given airspeed, total drag is at its minimum amount.
- In determining the maximum range of aircraft, minimizing drag minimizes the thrust to overcome it.
- The minimum power and maximum endurance occur at different points.
Maximum Endurance
- The best endurance airspeed is an airspeed that allows an aircraft to remain flying for the longest time.
- As weight increases, the airspeed required to maintain max endurance increases; however, the optimal angle of attack remains constant.
- As weight decreases, airspeed required to maintain max endurance decreases; however, the optimal angle of attack remains constant.
Factors Impacting Cruise Performance
-
Wind Impacts on Cruise Flight:
- Wind direction and intensity at various cruise altitudes are essential considerations to determine cruise performance.
- Winds aloft are the most direct means to plan for winds at cruise altitudes along the route of flight.
- Headwinds increase flight time and therefore fuel burn, reducing range, while tailwinds do just the opposite.
-
Icing Impacts on Cruise Flight:
- When encountering icing, additional power may be necessary to overcome the increase in drag.
- Airspeed may bleed off quickly (one example saw 50 knots in under 1 minute)
- See also: Stall and Climb Performance.
Applying Maneuvering Speed to Cruise
- Maneuvering speed, or Va, is an airspeed below which full deflection of the control surfaces should not cause damage.
- If approaching bumpy weather, consider slowing to Va before penetrating turbulence.
- Rule of thumb: for every 2% reduction in weight, Va reduces by 1%.
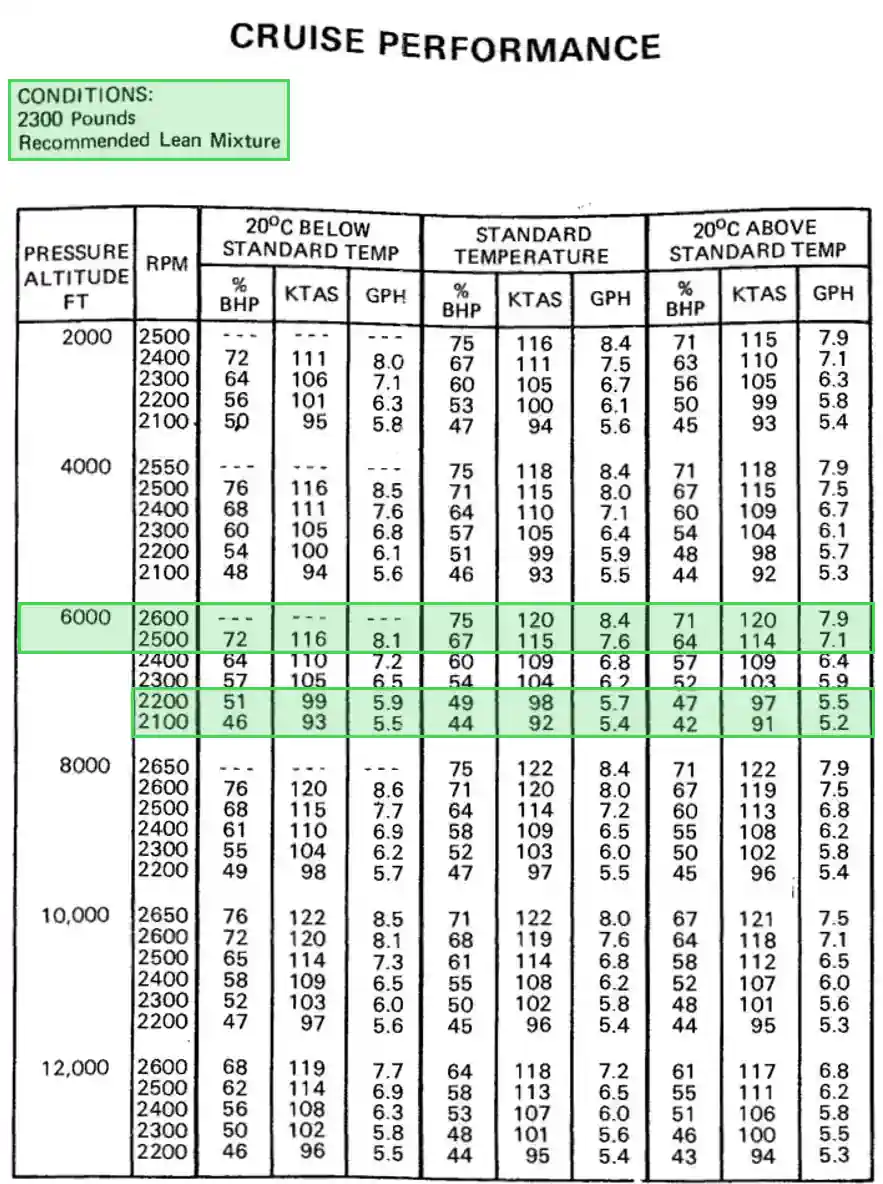
Aircraft Cruise Performance
- Cruise performance data enables pilots to plan long-distance, cross-country flights while simultaneously allowing pilots to determine fuel reserves.
-
Cruise Performance Chart Example:
- Start by choosing the chart that meets the prerequisites (i.e., weight, temperature).
- Choose the cruise altitude flown and move right to the appropriate temperature at altitude.
- The RPM dictates the desired performance.
- Fuel burn understandably increases with RPM setting:
- Using 6,000 feet at standard temperature, 2100 RPM is 5.4 Gallons Per Hour (GPH) at 92 knots.
- Increasing by 100 RPM increases fuel burn to 5.7 GPH (+6%) at 98 knots (+7%).
- As you increase RPM, the aircraft (at least in our example) will experience diminishing returns where fuel burn increases are larger, and speed benefits are less.
- Using 6,000 ft at standard temperature, 2500 RPM is 7.6 GPH at 115 knots.
- Increasing by 100 RPM increases fuel burn to 8.4 (+11%) at 120 Knots (+4%).
Cruise Performance Knowledge Check


Cruise Performance Conclusion
- Still looking for something? Continue searching: