Performance Calculations
Performance numbers can be derived from charts, tables, or by manually crunching the numbers yourself to predict aircraft performance.
Introduction to Performance Calculations
- Math is always going to be more accurate than charts.
- Charts provide a quick reference based on mathematical calculations but are subject to inaccuracies due to their simplicity and human error.
- When calculating performance, reference a pilot information manual and ALWAYS read the notes associated with the chart.
- Calculation Examples:
- Temperature Conversion.
- Crosswind Component.
- Short Field Takeoff Performance.
- Load Factor.
- Stall Speed Banked.
- True vs Magnetic North Course Conversion.
- Mach Number.
- Pressure Altitude.
- Density Altitude.
- Cloud Bases.
- Determining Rate-of-Climb Requirements.
- Maneuvering Speed.
- True Airspeed.
- Time to Travel using a Whiz Wheel.
- Ground Speed on Whiz Wheel.
- Fuel on Whiz Wheel.
Performance Calculations Key Highlights
- Performance calculations help pilots determine whether the aircraft can safely operate under existing conditions.
- Aircraft performance is affected by weight, altitude, temperature, wind, runway conditions, and atmospheric pressure.
- Takeoff and landing performance calculations determine required runway length and obstacle clearance capability.
- Density altitude significantly affects aircraft acceleration, climb rate, engine power, and aerodynamic performance.
- Performance data is published in the aircraft’s Pilot’s Operating Handbook (POH) and should be referenced during preflight planning.
- Wind conditions can improve or degrade aircraft performance depending on direction and intensity.
- Aircraft loading and center of gravity influence climb performance, stall characteristics, and overall handling.
- Pilots should apply appropriate safety margins when using published performance data under real-world conditions.
- Improper performance planning can result in runway overruns, inability to clear obstacles, or degraded aircraft controllability.
- Accurate performance calculations support safe aeronautical decision-making and improve operational risk management.
Pilot Technique
- Pilot technique is critical in determining the delta between the calculated and actual performance.
- Professional test pilots collect the data used to make charts, so results will likely differ from pilot to pilot.
Units of Measure
- Statute Mile: the same as a standard mile, as you would see driving a car.
- Nautical Mile: defined as one minute of arc along a meridian of the Earth. Using the widely accepted WGS84 ellipsoid model, this averages a nautical mile to 6,076 feet (1,852 meters), or 1.15 statute miles.
Temperature Conversion
- Celsius is the standard aviation unit for temperature.
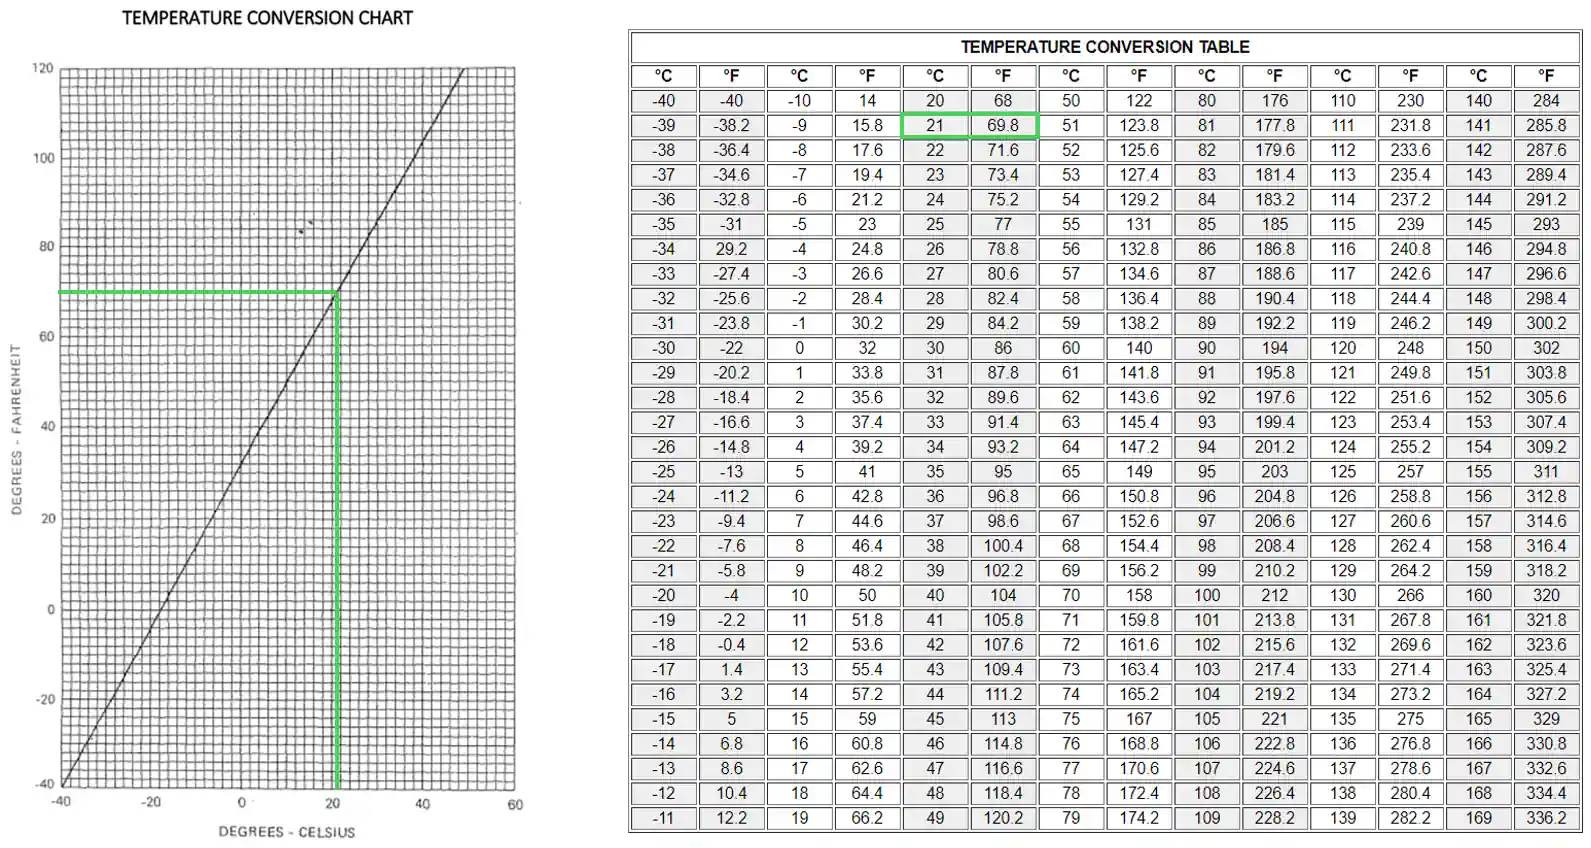
- Pilots convert between °F and °C using formulas, charts, or tables. []
-
Temperature Conversion Formula:
- °C = [(°F - 32) x 5/9].
- °F = [(°C x 9/5) + 32].
-
Temperature Calculation Example:
- 70°F day.
- °C = ((70°F-32) x 5/9).
- You should come out with 21.1°C.
-
Temperature Chart Example:
- Start at your initial temperature on the Fahrenheit scale.
- Move across until you hit the reference line.
- Move down and read the temperature off the bottom.
- In this example, it comes out to be roughly 22°C.
-
Temperature Conversion Table Example:
- Find the initial temperature and read across the column.
- Notice this table favors converting Celsius to Fahrenheit, but we still come out just over 21°C.
-
Crosswind Component
- The goal of a crosswind landing is to safely and accurately establish and maintain a stabilized approach, correcting for a crosswind during the approach, touchdown, and rollout.
-
Determining Crosswind Component:
- Pilots calculate crosswinds using various methods, each serving a purpose depending on the flight phase.
- When calculating the crosswind, always use the full gust component, meaning calculate crosswind as a "worst case" scenario.
- Consider your source for winds (true vs. magnetic) and remember if it's written, it's true; if it's spoken, it's magnetic:
- ATC reports, a windsock, or ATIS are magnetic
- METARs provide winds in true, but pilots can convert to magnetic.
- Remember, winds are variable, too, so only bother converting if operating at significant deviations.
- When calculating the crosswind, always use the full gust component, meaning calculate crosswind as a "worst-case" scenario.
-
Chart Method:
- Crosswind charts are in nearly every POH/PIM, but are not aircraft-specific, so any will do.
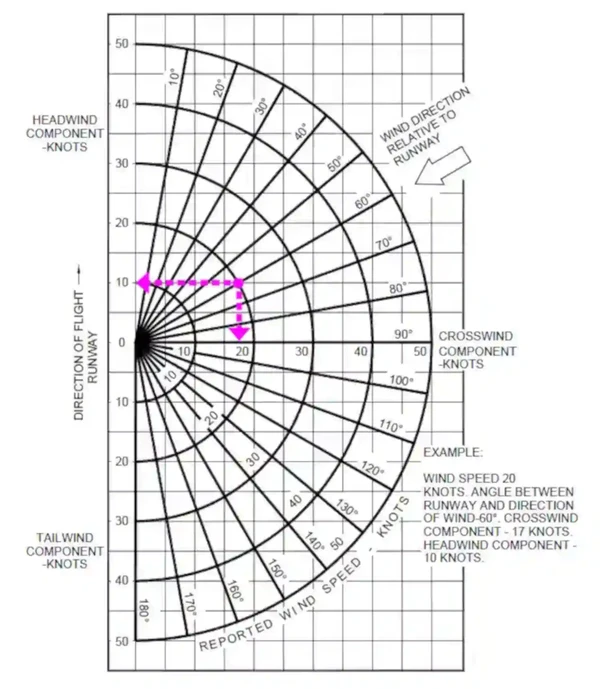
- Using the example provided in [], plot your point using the number of degrees off the runway heading, with the full gust component as strength.
- Let's say we're going to land at runway 360, and the wind is coming from 020 at 20 knots.
- We'll plot the wind strength at the 20° radial line (representing 20° off the runway) on the 20° point (representing the wind strength).
- From the plotted point, we move straight left to align with the headwind component, which is roughly 19 knots.
- We can also move straight down for the crosswind component: approximately 6 knots.
-
Heading Indicator Rule of Thumb:
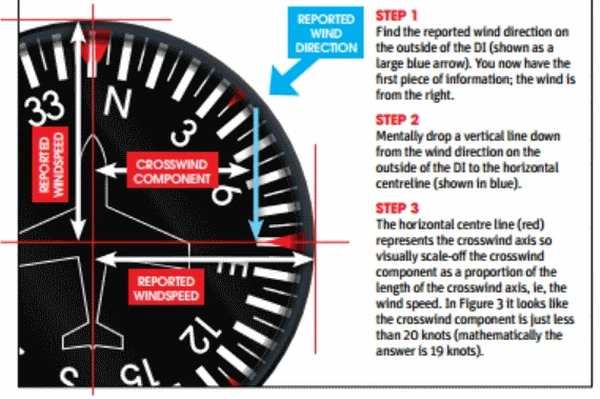
- Find the reported wind direction on the outside of the DI (shown as a large blue arrow). You now have the first piece of information: the wind is from the right. []
- Mentally drop a vertical line down from the wind direction on the outside of the DI to the horizontal centerline (shown in blue).
- The horizontal center line (red) represents the crosswind axis, so visually scale the crosswind component as a proportion of the axis's length, i.e., the wind speed.
- Using our example, this means our crosswind component is just less than 20 knots (mathematically, the answer is 19 knots).
-
Sixth Rule of Thumb:
- If the angle is 10°, then the crosswind component equals 1/6 of the wind strength.
- If the angle is 20°, then the crosswind component equals 2/6 (1/3) of the wind strength.
- If the angle is 30°, then the crosswind component equals 3/6 (1/2) of the wind strength.
- If the angle is 40°, then the crosswind component equals 4/6 (2/3) of the wind strength.
- If the angle is 50°, then the crosswind component equals 5/6 of the wind strength.
- If the angle is 60° or greater, then the crosswind component equals the wind strength.
-
Mathematical Formula:
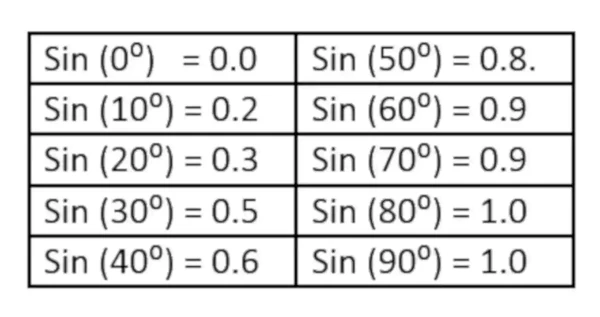
- The formula for crosswind component = Wind Speed x Sin (Wind Angle). []
- Example: If the wind is 310° at 17 knots and you line up to 330°, you can see you have a wind angle of 20°.
- Refer to the chart to find that the sine of 20° is 0.3. Then, multiply this value by the wind component of 17 knots to obtain a crosswind component of 5 knots.
Crosswind Component CalculatorEnter values to calculate wind components.


Short-Field Takeoff & Maximum Performance Climb
- Short field takeoffs & maximum performance climbs minimize runway length required by optimizing aircraft performance.
-
Short-Field & Maximum Performance Climb Table Example:
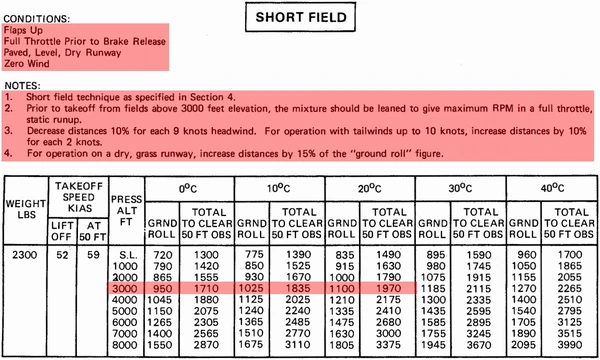
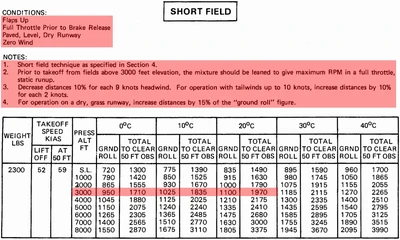
- Use the chart for all performance data specific to an aircraft. []
- Conditions:
- Aircraft Weight: 2300lbs.
- Altitude: 3,000' MSL.
- 20°C Outside Air Temperature.
- Typically, there will be more than one chart for the same operation, separated by weight or aircraft configuration conditions.
- Starting at the left with the altitude, continue to the right across the chart until you reach the corresponding temperature.
- We expect a 1,100' takeoff without obstacles and 1,970' with a 50' obstacle.
- With a headwind of 9 knots, the chart notes indicate a 9% decrease in distance.
- Pilots can expect a 990' takeoff without obstacles (1,100' - 9%) and a 1,773' takeoff (1,970' - 9%) with a 50' obstacle.
- With a tailwind of 2 knots, the chart notes indicate an increase in distance by 10%.
- With a tailwind of 4 knots (20% increase), pilots can expect a 1,320' takeoff without obstacles (1,100' x 120%) and a 2,364' takeoff with a 50' obstacle (1,970 x 120%).
- With a headwind of 9 knots, the chart notes indicate a 9% decrease in distance.
- While interpolation is acceptable, consider rounding up if your weight is not close to the reference weights they provide. Takeoff data will never improve with weight, so your numbers will be more conservative and provide a safety margin.
Load Factor
- Load factor is the weight the wings are supporting.
- Pilots will generally rely on the 60° angle of bank as a 2-Gs rule of thumb, while performance charts use technical data.
- Still, pilots can be more precise if they choose to use some relatively simple math.
-
Load Factor Formula:
- Load Factor Formula: Load Factor = 1 / cos(angle of bank).
-
Load Factor Calculation Example:
- Conditions: Given an angle of bank of 60°.
- Load Factor = 1 / cos(60).
- Load Factor = 1 / 0.5.
- Load Factor = 2.
-
Load Factor Chart Example:
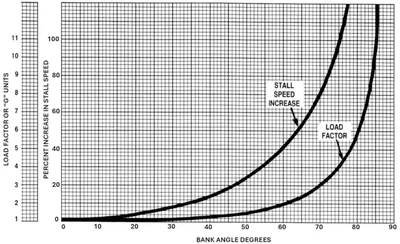
- Start with the 60° mark at the bottom of the chart and move up until you intercept the load factor reference line. []
- Move over to the left and see the load factor imposed on the aircraft.
- You should come up to approximately 2.

Stall Speed Banked
- Stall speed increases with load factor due to a loss in the vertical component of lift.
-
Stall Speed Banked Formula:
- Stall Speed Banked = [Stall Speed Level x Square Root of Load Factor].
-
Stall Speed Banked Calculation Example:
- Given an aircraft with a stall speed of 48 knots with a load factor of 2 (60° angle of bank).
- Stall Speed Banked = [Stall Speed Level / Square Root of Load Factor]
- Square Root of 2 = 1.41
- Stall Speed Banked = 48 x 1.41
- Stall Speed Banked = 68 KIAS
-
Stall Speed Banked Chart Example:
- Stall speed increases with load factor. []
- Look at the 60° mark at the bottom of the chart and move up until you intercept the stall speed increase reference line.
- Move over to the left and see the percent increase in stall speed.
- Stall speed should increase by approximately 41%.
- Stall Speed Banked = [Stall Speed Level x percent increase in stall speed].
- Stall Speed Banked = 48 x 1.41.
- Stall Speed Banked = 68 KIAS.
- Stall speed should increase by approximately 41%.
-
Stall Speed Banked Table Example:
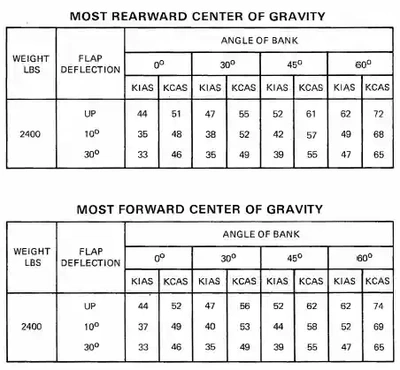
- Stall speeds change based on the location of the aircraft's center of gravity. []
- Assuming the pilot is operating at the forward limits (most dangerous), based on the flap deflection (if any), move right until reaching the bank angle flown.
- Read the speed associated with the indicated airspeed, that which you would see in the cockpit (reference KCAS as required for other calculations).
- If a bank angle is between those identified, interpolation may be necessary.
- Note that as the bank angle increases, the stall speed also decreases.

True to Magnetic Course Conversion
- Used primarily for flight planning when converting a chart (always true north) to a course to fly in the aircraft (magnetic north).
-
True to Magnetic Course Formula:
- "East is least, west is best."
- Magnetic Course (MC) = True Course (TC) - East Variation.
- Magnetic Course (MC) = True Course (TC) + West Variation.
-
True to Magnetic Course Example:
- True course is 270°.
- Variation is 14° east.
- MC = 270° - 14°.
- MC = 256°.
-
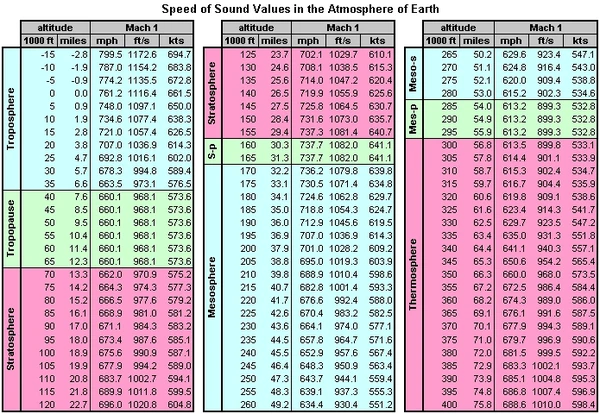
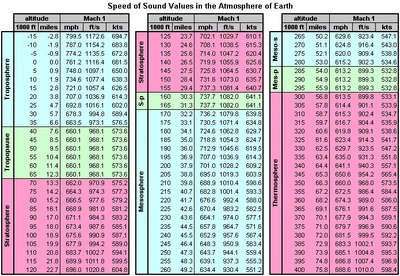
Mach Number
- Most high-speed aircraft are limited to a maximum Mach number at which they can fly.
- Machmeters display Mach numbers as a decimal fraction. []
-
Mach Number Formula:
- Mach Number = Aircraft Speed/Speed of Sound (dependent on altitude).
-
Mach Number Calculation Example:
- An aircraft is flying at 30,000'.
- Speed of sound at 30,000' = 589.4 knots.
- The airspeed is 489.3 knots.
- 489.3/589.5 = 0.83 Mach
-
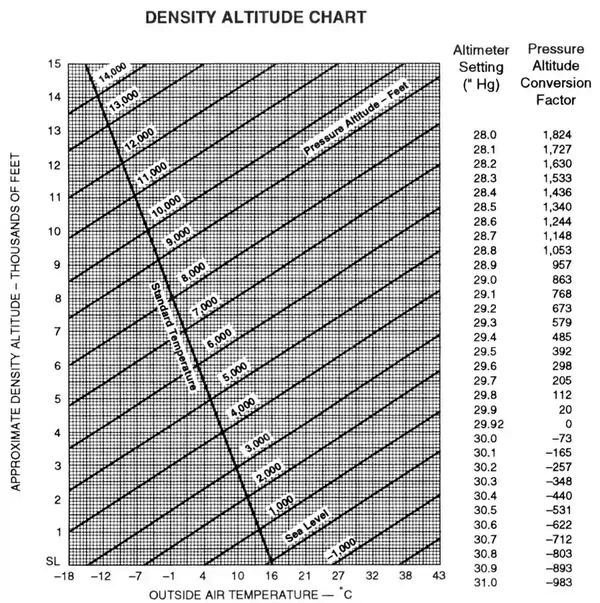
Pressure Altitude Corrections
- Pressure altitude is an altitude corrected for non-standard temperatures.
- As altitude increases, pressure will decrease in a standard atmosphere.
Pressure Altitude Corrections Formula:
- Pressure Altitude = [(29.92 - current baro) * 1000] + Current field elevation.
Example:
- Current baro: 29.82.
- Field elevation: 500'.
Calculate:
- 29.92-29.82 = .10.
- 0.10 * 1000 = 100'.
- 100' + 500' = 600'.
Chart:
[]- Using the chart on the right of the graph, look for the current altimeter setting.
- To the right of it, there will be an altitude in feet, and that is your conversion.
Density Altitude
- Pressure altitude corrected for non-standard temperature.
- Used for performance calculations
Density Altitude Formula:
- Pressure Altitude + (120 x [Outside Air Temperature (OAT) - (ISA Temp)])
-
Density Altitude Calculation Example:
- If a chart is not available the density altitude can be estimated by adding 120' for every degree Celsius above the ISA:
- Pressure Altitude = 600' (as calculated above)
- OAT: 10°C
- ISA Temp (using standard Lapse rate of -2 degrees C per 1000 ft) is 14° C
- 600' + [120 * (10-14)]
- 600' + (-480) = 120'
- If a chart is not available the density altitude can be estimated by adding 120' for every degree Celsius above the ISA:
-
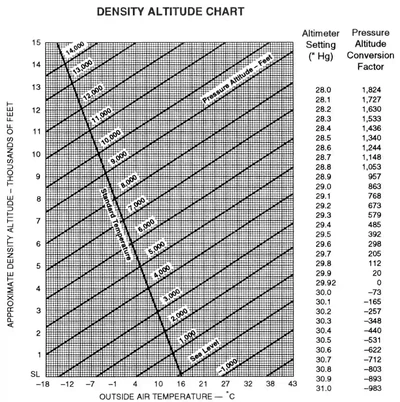
Density Altitude Chart Example:
- Pilot Operating Handbook Chart: []
- From the temperature on the bottom, move up to your pressure altitude
- Next move left and read your density altitude off the scale
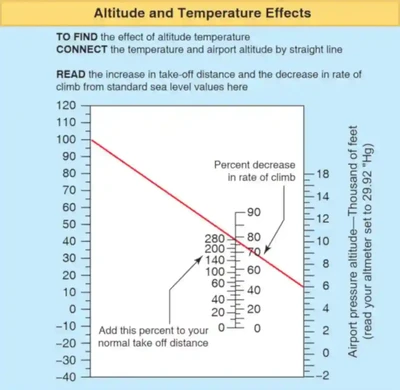
- Koch Chart: []
- If the pressure altitude is 6,000 feet and the temperature is 100°C, a straight line is drawn to connect.
- The line's intersection implies a 280% increase in normal take off distance and an 79% decrease in climb rate.
- Pilot Operating Handbook Chart: []
- Online tools are also available to help you calculate density altitude, such as Pilot Friend's Density Altitude Calculator.

Cloud Bases
- Cloud bases aid in VFR planning or when icing is a concern.
- The formula provides data relevant for planning, but conditions can change rapidly.
-
Cloud Bases Formula:
- Temperature-Dew Point (°C) divided by 2 (standard lapse rate) x 1,000 = Base of clouds.
- Temperature-Dew Point (°F) divided by 3.6 (standard lapse rate) x 1,000 = Base of clouds.
-
Cloud Bases Calculation Example:
- Temperature: 10°C / 50°F.
- Dew Point: 5 °C / 41°F.
- (10-5) ÷ 2 x 1,000 = 2,500' MSL.
- (50-41) ÷ 3.6 x 1,000 = 2,500' MSL.
-
Climb Gradient
- Climb gradient is an important performance calculation to ensure departure procedure compliance and, by extension, terrain clearance.
- The output of the calculation is the climb rate as feet per nautical mile (not feet per minute, as read off the Vertical Speed Indicator).
-
Climb Gradient Formula:
- Climb Rate ÷ (Ground Speed (GS) ÷ 60).
-
Climb Gradient Calculation Example:
- Ground Speed = 75 knots.
- Climb Rate = 250 feet per minute.
- 250 ÷ (75 ÷ 60) = 200 feet per mile required.
- Rate of climb is the altitude gain per unit of time, while climb gradient is the actual measure of altitude gained per 100 feet of horizontal travel, often expressed as a percentage.
- An altitude gain of 1.5 feet per 100 feet of travel (or 15 feet per 1,000 or 150 feet per 10,000) is a climb gradient of 1.5 percent.
Determining Rate-of-Climb Requirements
- Used to determine the rate of climb for a given departure/climb out.
Formula:
- Ground Speed (GS) (knots) ÷ 60 * Climb Gradient (Feet Per Mile).
Example:
- Ground Speed = 75 knots.
- Climb Gradient Required = 200 feet per mile.
Calculate:
- 75 ÷ 60 * 200 = 250 feet per minute climb rate required.
60-to-1 Rule
- The 60 to 1 rule is a technique for establishing predictable pitch changes for climbs or descents and lead points for intercepting courses or arcs.
- It allows the pilot to compute the pitch changes necessary when establishing an attitude during the control and performance concept of attitude instrument flying.
- It reduces the pilot's workload and increases efficiency by requiring fewer changes and less guesswork.
- It is an alternative to the TLAR (That Looks About Right) method of flying.
- The 60-to-1 rule gives us a mathematical equation to help you figure out all these questions, but it is almost impossible to run these calculations and fly at the same time.
- You need to use the formulas before you fly.
- One degree of course change will put you 1 NM off course after 60 NMs.
- Find out what your turn radius is at cruise airspeed up high and at approach airspeed down lower; find out what a 1° pitch change will do to your VVI, and remember those numbers.
- The 60-to-1 Rule:
- 1° = 1 NM at 60 NM (60 NM from the station, there is 1 NM between each radial).
- 1° = 100 FT at 1 NM (1° climb or descent gradient results in 100 FT/NM).
-
Distance Planning With The 60-to-1 Rule:
- 60-to-1 Rule: An aircraft traveling at 60 knots travels 1 NM/minute.
- After 60 minutes at 60 knots, the pilot will have flown 60 NM.
- Doubling those numbers more accurately represents GA aircraft, meaning 120 knots for 60 minutes is 120 NM.
-
Descent Planning With The 60-to-1 Rule:
- The 60 to 1 rule states that for every 1 degree of shift (up/down/left/right), an offset of 100 feet per 1 Nautical Mile (NM) occurs.
- As it relates to descent planning, this means for every 1 degree the pitch is lowered (relative to level flight), you will lose 100 feet every NM.
-
Practical Application:
- Example: A pilot is 20 NM away from an airport at 6,000' MSL to enter the downwind at 1000' MSL.
-
Determining Pitch Angle:
- We have 5,000' to lose over 20 NM.
- If we take the altitude to lose and divide it by the distance (5,000'/20NM), we see that we need to lose 250 feet every 1 NM.
- Referencing the 60-to-1 rule, if a 1-degree pitch down is 100' per 1 NM, then a 2.5-degree pitch down is 250' per 1 NM.
-
Determining Vertical Speed:
- We determined that our pitch must be 2.5 degrees down. Since we're flying at a constant speed, this translates to a predictable vertical speed, which we can calculate.
- If you multiply the descent angle (2.5 degrees in the above example) by the Nautical Miles-per-minute and then multiply that number by 100, you get the Feet Per Minute (FPM) descent rate.
- Shown another way: (NM per Min * Pitch down * 100 = Descent in Feet per Minute).
- First, determine nautical miles per minute:
- Divide the airspeed (NM per Hour) by 60 (Minutes per hour) to get Nautical Miles per minute.
- If we intend to descend at 90 knots, we divide that by 60 and get 1.5 NM per minute.
- Second, determine vertical speed:
- If we then multiply our NM per minute by our pitch-down of 2.5 degrees, we get 3.75
- Multiply 3.75 by 100, and you get 375 feet per minute.
- Another way of doing the same thing is knowing we have 20 NM to travel at 1.5 NM/Minute; we can determine that we have approximately 13 minutes to lose 5,000 feet.
- 5000 divided by 13 = 384 FPM.
-
Working Backwards:
- We can work backward, too. For example, let's say we wish to descend at 200 FPM for passenger comfort.
- If we are traveling at 1.5 NM per minute, and we have 5,000' to lose at 200 FPM, it will take 25 minutes to accomplish this descent (5,000'/200 FPM).
- Since we calculated that ~375 FPM was required when 20 NM out, and we plan to reduce our rate of descent, we need to begin descending earlier.
- Assuming we are flying at 1.5 NM per minute and need 25 minutes to descend, we should begin our descent at 37.5 NM away (25 * 1.5).
- Additionally, instrumentation may display how far away the aircraft is from a known point.
- If instrumentation displays 5 minutes to a point, and the pilot needs to descend 1000' in that time, then feet (1,000) divided by minutes (5) equals the required feet per minute, in this case 200 feet per minute.
- If we are traveling at 1.5 NM per minute, and we have 5,000' to lose at 200 FPM, it will take 25 minutes to accomplish this descent (5,000'/200 FPM).
- Note that the 60-to-1 rule is a rule of thumb and not an exact science, but it is accurate enough to guide basic decisions and cross-check expected performance.
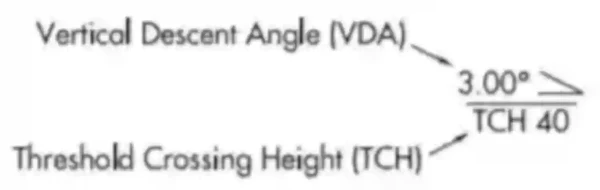
- When flying a non-precision approach, a Vertical Descent Angle (VDA) and Threshold Crossing Height (TCH) may be published. For Copter approach procedures, a Heliport Crossing Height (HCH) replaces the TCH. The VDA is strictly advisory and provides a means to establish a stabilized descent to the Minimum Descent Altitude (MDA). The presence of a VDA does not guarantee obstacle protection in the visual segment. If there are obstacles in the visual segment that could cause an aircraft to destabilize the approach between MDA and touchdown, the profile will not show a VDA. Instead, it will display a note stating "Visual Segment-Obstacles."
- When descending to MDA, consider the time needed to level off and stabilize to assess the landing environment and "break out" to land.
- Pay attention to shock cooling, whereby operations at a lower engine setting for extended periods can quickly cool an engine.
- Bold Method has several excellent articles that discuss descent planning, including: "How the 60-1 rule helps you plan a perfect descent and know when to reduce the throttle when given a "descent at pilot's discretion" and "How To Calculate Your Descent Rate To MDA".
- We can work backward, too. For example, let's say we wish to descend at 200 FPM for passenger comfort.
- VSI Versus Pitch Change:
- We now know how to calculate the altitude gained or lost for each degree of pitch change over a given distance.
- Throw in a time factor using True Airspeed (TAS) expressed in NM per MIN, and we can relate this pitch change to a change in VSI.
- First, convert speed to NM/MIN, as the 60-to-1 rule is TAS-based and expressed in NM/MIN.
- NM/MIN can be obtained easily from TAS as follows: NM/MIN = TAS/60.
- Examples:
- 120 KTAS = 2 NM/MIN.
- 150 KTAS = 2.5 NM/MIN.
- If we don't have a TAS indicator, pilots can compute IAS from TAS.
- TAS increases over IAS at the rate of 2% per 1,000 feet altitude increase.
- So: TAS = IAS + (2% per 1,000 FT) X (IAS).
- Example: 3,000 FT; 150 KIAS.
- TAS = 150 + (2% X 3) (150) = 150 + (.06)(150) = 159 KTAS.
- Example: 3,000 FT; 150 KIAS.
- Another easy but less accurate rule of thumb (best used above 10,000 feet) to determine TAS is: TAS = IAS + Flight Level (FL)/2 or "Add five kts per 1,000' to IAS."
- Example: FL 200; 175 KIAS
- TAS = 175 + (200/2) = 275 KTAS.
- If one degree equals 100 ft/nm, then our VSI can be calculated in numerous ways:
- VSI for 1° pitch change = NM/MIN X 100 FT.
- VSI = (Pitch Angle) X (NM/MIN X 100).
- VSI = (Gradient) X (NM/MIN) = (FT/NM) X (NM/MIN).
- Example: FL 200; 175 KIAS

Time, Fuel, and Distance to Climb
- Aircraft departing the terminal area are operating at or near maximum performance, which means time to climb, fuel required to climb, and the distance covered are unique to climb and different from those observed in cruise.
-
Time, Fuel, and Distance to Climb Example:
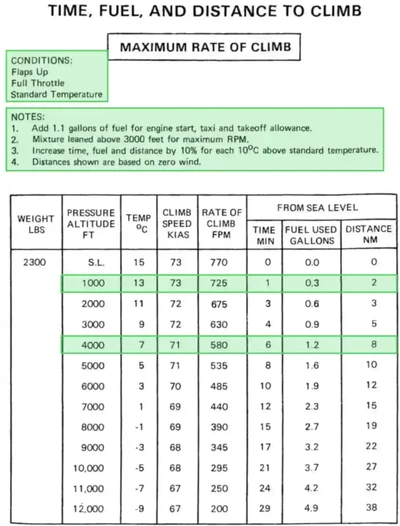
- As always, pay attention to the conditions and notes listed for which the chart data is collected. []
- Assuming a climb to 4,000 feet pressure altitude from an airport at 1,000 feet pressure altitude.
- Start with the 4,000 feet row and look across, to a time of 6 minutes, 1.2 gallons used, and 8 NM traveled.
- If the airport was already at 1,000 feet, we don't need to account for the first 1,000 feet of time, distance, and fuel data.
- Time is therefore 5 (6-1) minutes, 0.9 (1.2-0.3) gallons, and 6 (8-2) NM.
- If the temperature was 15° hotter than standard, time, fuel, and distance can be increased by 15%:
- The new result would be 6 minutes, 1.0 gallons, and 7 NM traveled.
- If expecting a headwind, the actual performance will likely be better than the calculated one.
- Still, using conservative numbers is best for planning.
- Some chart notes may not pertain directly to the chart, but are essential for planning, like Note 1 stating "add 1.1 gallons of fuel for engine start, taxi, and takeoff allowance. []
- This number is the SETTO, or start, taxi, and takeoff fuel, which pilots account for using before takeoff.

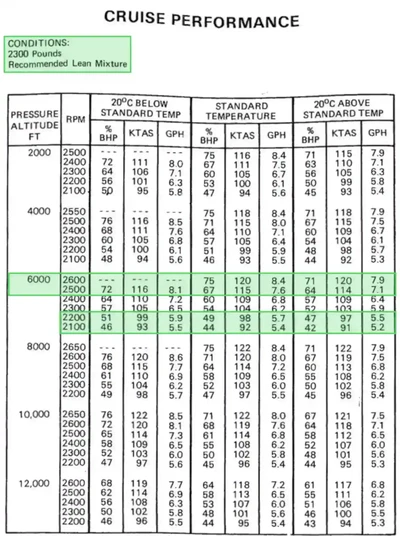
Aircraft Cruise Performance
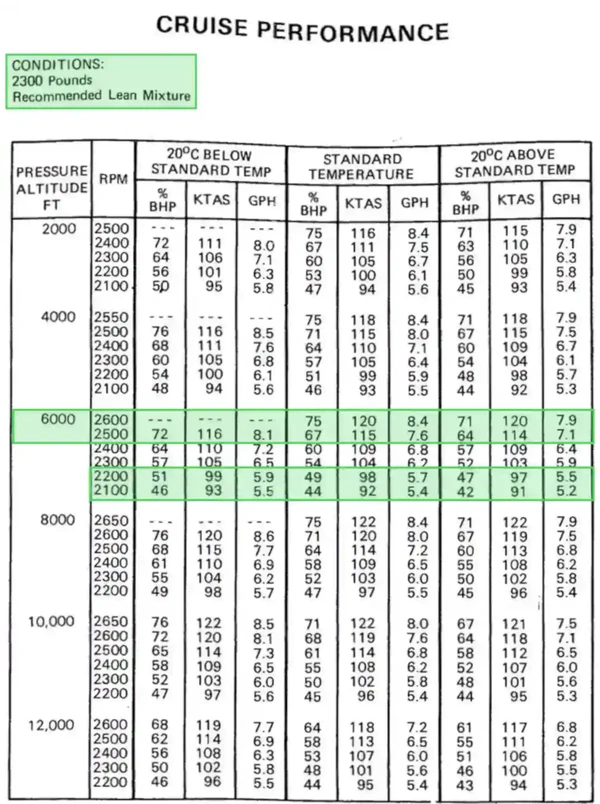
- Cruise performance data enables pilots to plan long-distance, cross-country flights and determine fuel reserves. []
-
Cruise Performance Chart Example:
- Start by choosing the chart that meets the prerequisites (i.e., weight, temperature).
- Choose the cruise altitude flown and move right to the appropriate temperature at altitude.
- The RPM dictates the desired performance.
- Fuel burn understandably increases with RPM setting:
- Using 6,000 feet at standard temperature, 2100 RPM is 5.4 Gallons Per Hour (GPH) at 92 knots.
- Increasing by 100 RPM increases fuel burn to 5.7 GPH (+6%) at 98 knots (+7%).
- As you increase RPM, the aircraft (at least in our example) will experience diminishing returns where fuel burn increases are larger and speed benefits are less.
- Using 6,000 ft at standard temperature, 2500 RPM is 7.6 GPH at 115 knots.
- Increasing by 100 RPM increases fuel burn to 8.4 (+11%) at 120 Knots (+4%).
Takeoff and Landing Performance
- Specific charts and their instructions are inside the pilot operating manual/pilot information manual for your aircraft.
- The numbers provided are under particular conditions that will rarely apply precisely to your conditions.
- Determine what your personal minimums are, and add a buffer to the performance calculated.
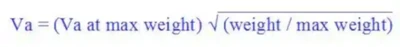
Maneuvering Speed
- Also referred to as Va.
- As weight increases, maneuvering speed also increases.
- More weight = more stable.
Formula:
- See []
Example:
- Follow the instructions given in section 6 of the POH.

Determining Top of Descent
- When transitioning from the en route to the terminal environment, the pilot must consider their distance from the destination and begin their descent accordingly.
- This distance, also known as Top of Descent (TOD), is not to the airport itself, but to a point where terminal procedures commence.
- For a VFR flight, this may be a distance from which to enter the traffic pattern.
- For an IFR flight, this may be a distance from which to begin an approach (FAF or feeder fix).
- Note for IFR, ATC instructions may dictate that a descent begin at a distance different from the calculated top of descent; however, knowing these numbers allows pilots to be proactive in requesting a descent if the instructions are not conducive to safe operations.
-
Top of Descent Formula:
- Rule of Thumb: TOD = (change in altitude ÷ 1000) x 3 = Top of Descent (NM).
- Formula: TOD = Tan(descent angle) x change in altitude.
-
Top of Descent Calculation Example:
- First, determine the desired MSL altitude:
- Assume a pilot is descending to enter a 1,000-ft traffic pattern at their destination airport.
- Desired altitude: 1,000 ft AGL (traffic pattern altitude).
- Airport elevation: 1,000 ft.
- Desired MSL altitude = desired AGL altitude + airport elevation.
- Desired MSL altitude = 1,000 ft + 1,000 ft.
- Desired MSL altitude = 2,000 ft.
- Second, determine the altitude to lose:
- Current altitude: 7,000 ft.
- Desired MSL altitude: 2,000 ft.
- Assuming a 3° glide slope.
- Altitude to lose = current altitude - desired MSL altitude.
- Altitude to lose = 7,000 ft - 2,000 ft.
- Altitude to lose = 5,000 ft.
- If using our rule of thumb, TOD = (5,000 ft ÷ 1,000 ft) x 3 = 15 NM
- If using trigonometry:
- Determine the tangent angle, in this case, 90 - 3° = 87°.
- TOD = Tan (87) x 5,000 ft.
- TOD = 95,406 ft.
- Finally, convert ft to NM by dividing by 6,076 ft (the number of feet in a NM).
- TOD = 95,406 ft/6076 ft.
- TOD = 15.7 NM.
- First, determine the desired MSL altitude:
- It is a good idea to provide a buffer to level out and stabilize before reaching the desired altitude.
- Consider adding a few NM to the TOD to provide that buffer.
Determining Approach Rate of Descent
- The rate of descent is another factor to consider when descending to a lower altitude or reaching the terminal environment.
- Considerations include: time available, passenger comfort, and safety.
- When flying an instrument approach, determining the descent rate for a non-precision approach enables pilots to maintain stabilization, ensuring the aircraft reaches the MDA at a distance from the threshold that allows landing in the touchdown zone.
- Assuming a pilot desires to fly a 3° descent angle, the rate of descent is simply ground speed multiplied by 5.
-
Rate of Descent (3° glide slope) Formula:
- Formula 1: Rate of Descent = Ground Speed (GS) x 5.
- Formula 2: Rate of Descent = Half of GS, then add a zero.
-
Rate of Descent Calculation (3° glide slope) Example:
- Formula 1:
- GS = 120.
- Rate of Descent = 120 x 5.
- Rate of Descent = 600 FPM.
- Formula 2:
- GS = 120.
- 120 ÷ 2. = 60.
- Add a zero = 600 FPM.
- Formula 1:
Rate of Descent Required
- Specific situations, such as instrument approaches, may require a minimum rate of descent to achieve the required altitudes.
-
Rate of Descent Required Formula:
- Rate of Descent Required: altitude to lose ÷ time to travel.
-
Rate of Descent Required Calculation Example:
- TDZE altitude: 400 ft MSL.
- FAF altitude: 2,000 ft MSL.
- GS: 120 knots.
- Distance between FAF and MDA: 4 NM.
- Altitude to lose: Touchdown Zone Elevation (TDZE) - Final Approach Fix (FAF) altitude.
- Altitude to lose: 2,000 ft - 400 ft.
- Altitude to lose: 1,600 ft.
- Time to travel: (FAF - MDA) x (GS ÷ 60).
- Time to travel: 4 NM x (120/60).
- 4 * 2 min = 800 FPM.
- Again, consider arriving at your desired altitude with some time (maybe 1 minute) to stabilize and re-establish cruise before performing the next maneuver.
Determining Descent to Landing Point on Approach
- When reaching a minimum descent altitude, pilots are permitted to remain at that altitude until reaching the missed approach point.
- Unfortunately, oftentimes the missed approach point is at or very close to the airport, making a safe landing hazardous.
- Pilots can calculate the point from the runway threshold at which they are no longer in a position to make a 3° glideslope.
-
MDA Descent Point Formula:
- Descent point (3° glideslope) = (MDA-TDZE)/300.
-
MDA Descent Point Calculation Example:
- MDA: 800' MSL.
- TDZE: 400' MSL.
- Descent Point: (800 - 400)/300.
- Descent Point: 1.3 NM from threshold.
- Note pilots should be crossing the runway threshold at a nominal height of 50' above the TDZE.
Determining Descent to Landing Point on Approach
- Knowing the descent point helps pilots make decisions.
- Knowing the rate of descent required ensures pilots know what performance to expect on the descent.
-
MDA Descent Point Rate of Descent Formula:
- DP Rate of Descent = GS ÷ 2 x 10.
-
MDA Descent Point Rate of Descent Calculation Example:
- Ground speed: 90 Knots.
- DP Rate of Descent: 90 knots/2 = 45.
- DP Rate of Descent: 45 x 10 = 450 FPM.
Applying Cold Temperature Altitude Corrections on an Approach
- Pilots determine corrections using the all-segments method and the individual-segments method.
-
All Segments Method:
- Pilots may correct all segment altitudes from the IAF altitude to the MA final holding altitude.
- Pilots only need to use the published "snowflake" icon/CTA temperature limit on the approach chart for making corrections.
- When the aircraft is not using a compensating system, manual corrections are necessary.
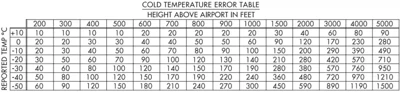
- The ICAO Cold Temperature Error Table is used to calculate the correction needed for the approach segment(s). []
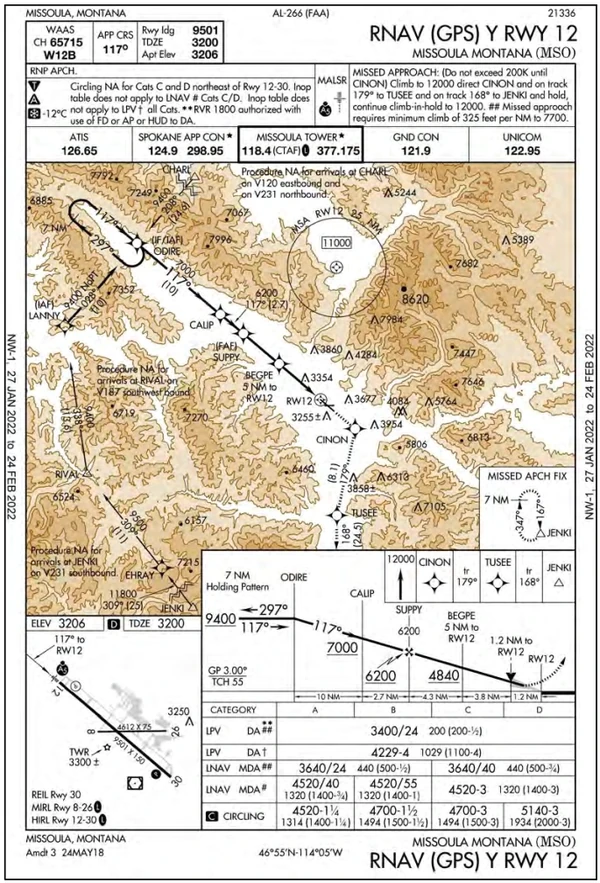
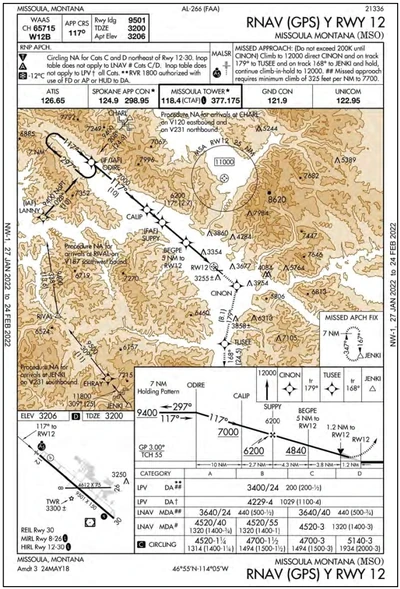
- Supposing the RNAV (GPS) Y RWY 12 into Missoula, Montana. []
-
Manual Corrections Outside the FAF:
- Cold temperature restricted airport temperature limit: -12°C.
- Final Approach Fix (FAF) (SUPPY) Altitude = 6200 ft.
- Airport elevation: 3206 ft.
- Difference: 6200 - 3206 = 2994 ft.
- Using the ICAO Cold Temperature Error Table:
- Start with the 3,000 ft (2,994 ft rounded up) height above the airport and move down the chart to the reported temperature.
- If the temperature is -10°C, a 290 ft correction is required.
- If the temperature is -20°, a 420 ft correction is required.
- 420 - 290 = 130 ft across 10°, which is 13 ft per °C.
- The correction required is 290 + 26 ft, or 316 ft, which rounds up to 320 ft.
- Start with the 3,000 ft (2,994 ft rounded up) height above the airport and move down the chart to the reported temperature.
- Add 320 ft. to the FAF and all procedure altitudes outside of the FAF up to and including IAF altitude(s):
- LANNY (IAF), CHARL (IAF), and ODIRE (IAF Holding-in-Lieu): 9400 + 320 = 9720 ft.
- CALIP (stepdown fix): 7000 + 320 = 7320 ft.
- SUPPY (FAF): 6200 + 320 = 6520 ft.
- The procedure to calculate manual corrections inside the FAF is the same as outside the FAF, except pilots subtract the airport elevation from the MDA or DA (versus the FAF described above).
-
Manual Corrections Inside the FAF:
- Cold temperature restricted airport temperature limit: -12°C.
- LP MDA: 4,520 ft.
- Difference: 4520 - 3206 = 1,314 ft.
- Using the ICAO Cold Temperature Error Table:
- While you can interpolate between the height above the airport and reported temperature fields, it is often best to round up (in this case, to 1,500 ft) for added safety and simplify the calculation.
- If the temperature is -10°C, a 150 ft correction is required.
- If the temperature is -20°C, a 210 ft correction is required.
- 210 - 150 = 60 ft across 10°, which is 6 ft per °C.
- The correction required is 150 + 12 ft, or 162 ft, which rounds up to 170 ft.
- While you can interpolate between the height above the airport and reported temperature fields, it is often best to round up (in this case, to 1,500 ft) for added safety and simplify the calculation.
- Add 170 ft. to the LP MDA, including any intermediate steps within the FAF as applicable.
-
Manual Corrections for Missed Approach Holding Altitude:
- Follow the same steps as outside the FAF.
-
Temperature-Compensating Systems:
- If flying an aircraft equipped with a system capable of temperature compensation, follow the instructions for applying temperature compensation provided in the airplane flight manual (AFM), AFM supplement, or system operating manual. Ensure that the temperature compensation system is on and active before the IAF and remains active throughout the entire approach and missed approach.
- Pilots who have a system that can calculate a temperature-corrected DA or MDA may use the system for this purpose.
- Pilots who have a system unable to calculate a temperature-corrected DA or MDA will manually calculate an altitude correction for the MDA or DA.
- Note: Some systems apply temperature compensation only to those altitudes associated with an instrument approach procedure loaded into the active flight plan, while other systems apply temperature compensation to all procedure altitudes or user-entered altitudes in the active flight plan, including altitudes associated with a Standard Terminal Arrival (STAR). For those systems that apply temperature compensation to all altitudes in the active flight plan, delay activating temperature compensation until the aircraft has passed the last altitude constraint associated with the active STAR.
- If flying an aircraft equipped with a system capable of temperature compensation, follow the instructions for applying temperature compensation provided in the airplane flight manual (AFM), AFM supplement, or system operating manual. Ensure that the temperature compensation system is on and active before the IAF and remains active throughout the entire approach and missed approach.
-
Individual Segment(s) Method:
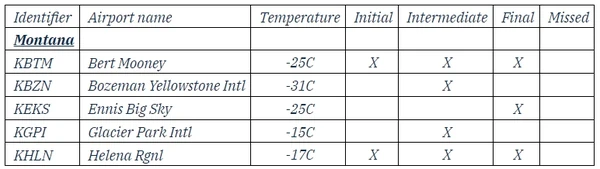
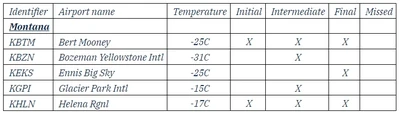
- Pilots are allowed to correct only the marked segment(s) indicated in the CTA list (https://www.faa.gov/air_traffic/flight_info/aeronav/digital_products/dtpp/search/).
- Pilots using the Individual Segment(s) Method will reference the CTA list to determine which segment(s) need a correction. []
- When the aircraft is not using a compensating system, manual corrections are necessary.
- The ICAO Cold Temperature Error Table is used to calculate the correction needed for the approach segment(s). []
-
Manual Correction for Initial Segment:
- The initial segment is all altitudes from the intermediate fix (IF) altitude up to and including the IAF altitude.
- Pilots calculate corrections by using the "Manual Corrections Outside the FAF" technique outlined above.
-
Manual Correction for Intermediate Segment:
- The intermediate segment encompasses all altitudes from the FAF/PFAF up to, but not including, the IF altitude.
- Pilots calculate corrections by using the "Manual Corrections Outside the FAF" technique outlined above.
-
Manual Correction for Final Segment:
- The final segment corrects for the MDA or DA for the approach flown.
- Pilots calculate corrections by using the "Manual Corrections Inside the FAF" technique outlined above.
-
Manual Correction for the Missed Approach Segment:
- The missed approach segment is all altitudes on the missed approach.
- Pilots calculate corrections by using the "Manual Corrections for Missed Approach Holding Altitude" technique outlined above.
-
Temperature-Compensating Systems:
- Aircraft with temperature compensating system: If flying an aircraft equipped with a system capable of temperature compensation, follow the instructions for applying temperature compensation provided in the AFM, AFM supplement, or system operating manual. Ensure the temperature compensation system is on and active before reaching the segment(s) requiring correction. Manually calculate an altimetry correction for the MDA or DA. Determine an altimetry correction from the ICAO table based on the reported airport temperature and the height difference between the MDA or DA, as applicable, and the airport elevation, or use the compensating system to calculate a temperature-corrected altitude for the published MDA or DA if able.

True Airspeed
- MOVED! See more about crosswinds on the Airspeed Indicator page


Recalculating Fuel Reserves Inflight
- When flights do not proceed as planned, fuel planning numbers calculated on the ground may become inaccurate.
- If changing course or destination in a way that is significantly different from the planned route, pilots must recalculate fuel reserves.
- With the fuel burn at cruise already known, pilots must calculate the fuel burn for their new cruise distance/time and add the appropriate reserve.
- Example:
- Assume there is a new destination with a straight line distance of 20 NM away from the airplane's current location.
- Fuel burn at cruise is known to be 7 GPH.
- Time to destination with current winds is 14 minutes.
- The fuel burn at cruise is therefore 1.63 total gallons.
- A 30-minute reserve requires 3.5 gallons, and a 45-minute reserve requires 5.25 gallons.
- Assuming the cruise burn at cruise and the reserves are available, it is a viable diversion (note that if diverting due to unplanned circumstances, the reserve fuel covers the diversion).
Time to Travel Using a Whiz Wheel
- Point the black arrow to match the expected ground speed.
- Look for the distance to travel on the outer wheel.
- Read the time immediately below (inner scale), the number representing distance.
Ground Speed on Whiz Wheel
- Line up distance over time (outer wheel over inner).
- Find the big black arrow; it is pointing to your ground speed.
- Note that you will travel 10% of your speed in 6 minutes (6 min * 10 = 60 minutes).
Fuel on Whiz Wheel
- Point the big black arrow to the pounds per hour (burn rate).
- Read time off the inner wheel.
- Look at the time above to get the number of pounds burned in that time.
Performance Calculations Interactive Scenario
Interactive Scenario
Loading scenario details...
Decision 1
0%
Scenario Complete
Performance Calculations Conclusion
- Many calculations are rules of thumb that are constantly handy.
- Note that while extrapolation or interpolation are skills pilots need to read charts, when you're parameters are off the chart, you're a test pilot, and performance in these regions should be prohibited.
- Reference materials such as the Pilot's Pocket Handbook: Flight Calculations, Weather Decoder, Aviation Acronyms, Charts and Checklists, Pilot Memory Aids, and Pilot's Rules of Thumb - featuring rules of thumb, easy aviation math, handy formulas, and quick tips - can come in handy.
- Still looking for something? Continue searching:
Performance Calculations References