Weather Depiction Chart
A weather depiction chart is a computer-generated chart (with human frontal analysis) that compiles local reports.
Introduction to Weather Depiction Chart
- A weather depiction chart is a computer generated (with human frontal analysis) from METAR reports
- It gives a broad overview of observed flying category conditions
Weather Depiction Chart Key Highlights
- Meteorological Impact Statements (MIS) provide aviation weather forecasters and air traffic managers with strategic weather impact information affecting air traffic operations.
- MIS products summarize expected weather hazards such as thunderstorms, turbulence, icing, low ceilings, reduced visibility, and convective activity.
- Air Route Traffic Control Centers and aviation weather units use MIS information to support traffic flow management and operational planning.
- Meteorological Impact Statements help identify weather conditions likely to affect routing, delays, airport capacity, and airspace utilization.
- MIS products are generally focused on large-scale operational impacts rather than tactical pilot weather decision-making.
- Forecasters develop MIS guidance using weather models, radar imagery, satellite data, pilot reports, and forecast products.
- Convective weather, winter storms, volcanic ash, and widespread IFR conditions commonly generate significant MIS operational concerns.
- Pilots may encounter MIS-related weather impacts through reroutes, delays, ground stops, or airspace flow restrictions.
- Weather conditions described in MIS products can evolve rapidly and should be monitored with current aviation weather information.
- Understanding Meteorological Impact Statements improves weather awareness, operational planning knowledge, and overall aviation safety.
Issuance & Validity
- Issued every 3 hours
- Information is about 1 hour old
- Information is all observed data
- Should be supplemented with current METAR reports
Information
-
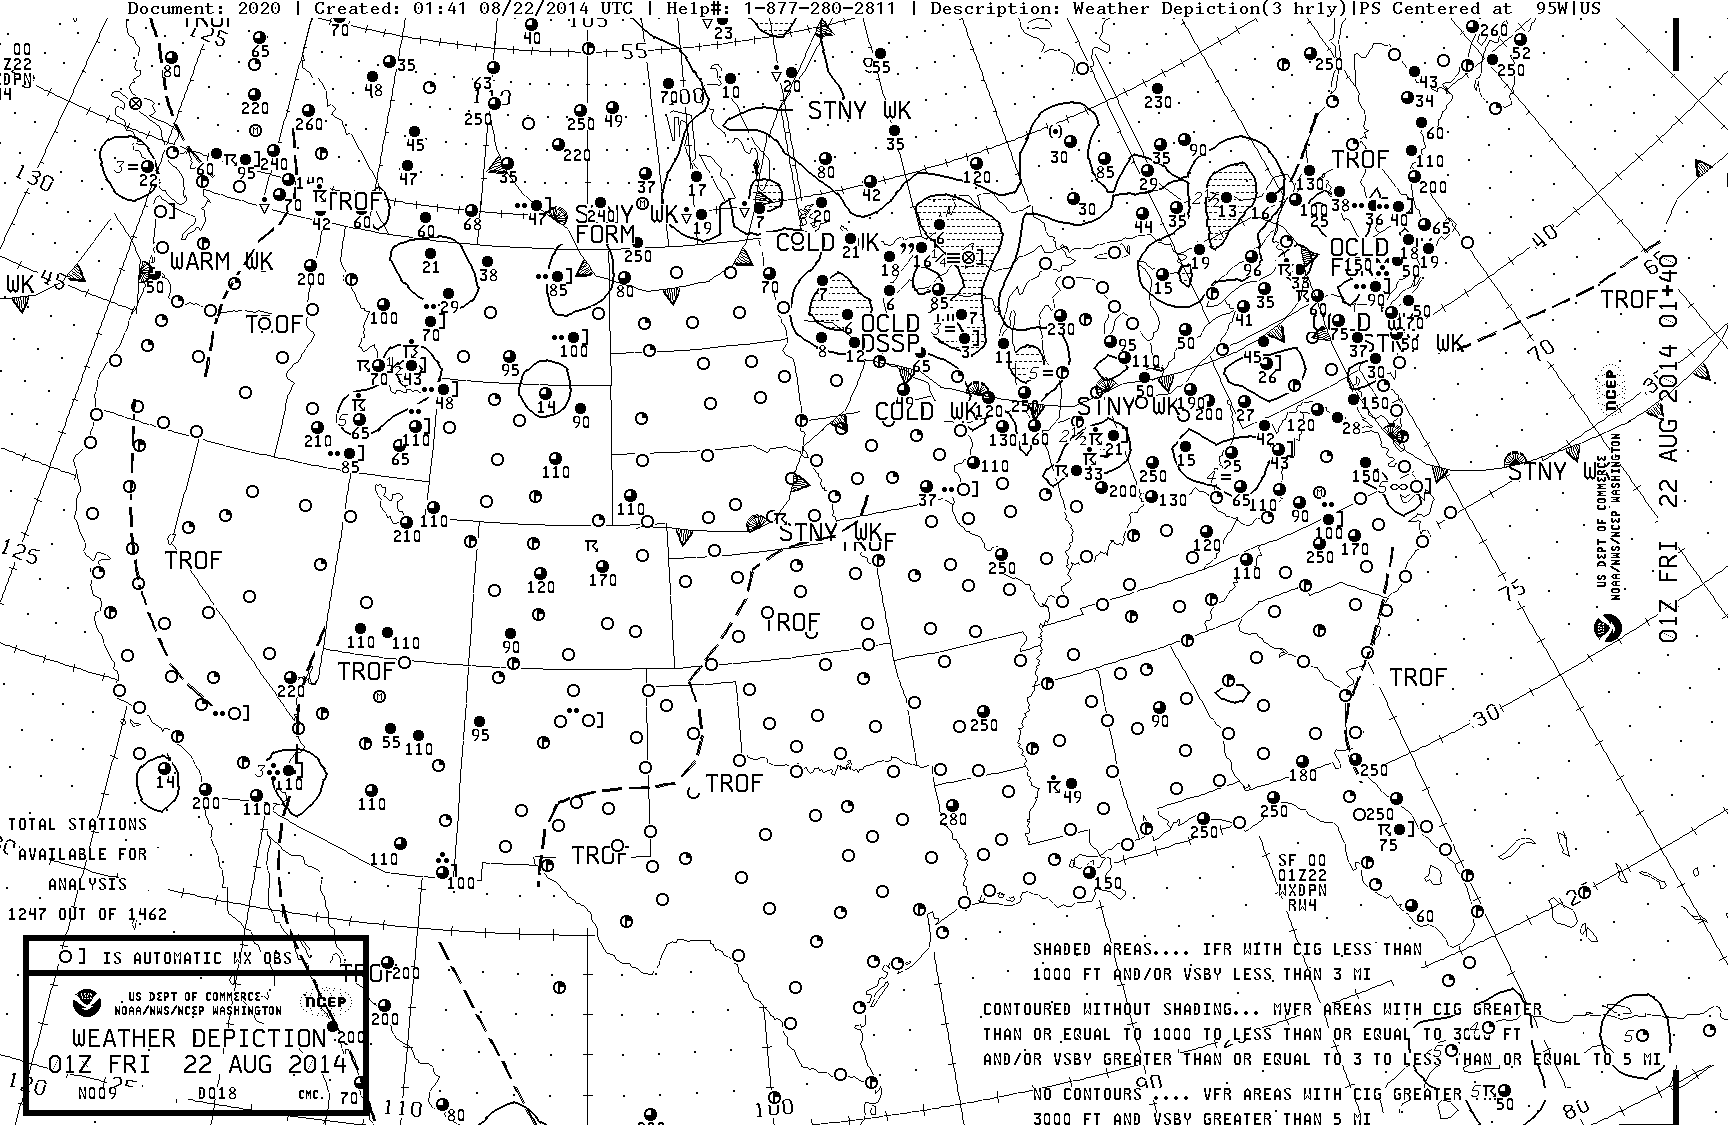
Weather Depiction Chart - Observation reported by both manual and automated observation
- Right bracket (]) indicates the present weather information was obtained by an automated system only
- The plotted data are total sky cover, ceilings, weather and visibility, and cloud height
- A legend is printed on the chart
Sky Cover
Cloud Heights
- Cloud heights are AGL in hundreds of feet
- Sky cover is entered as the lowest broken or overcast layer
- Computers cannot differentiate between partial obscuration and a missing observation therefore the computer will enter an M and the user cannot tell which is present and must reference a METAR
Weather and Obstructions to Visibility
- Weather and obstructions to visibility are entered to the left of the station circle
- Information is plotted if the weather is significant such as a thunderstorm
Visibility
- When visibility is 5 miles or less, it is entered to the left of the weather obstructions to vision symbol
- Visibility is entered in statued miles and fractions of a mile
Analysis
- IFR: Ceilings less than 1,000 feet and/or visiblity less than 3 miles; hatched area outlined by a smooth line
- MVFR: ceiling 1,000 to 3,000 feet inclusive and/or visibility 3 to 5 miles inclusive; non-hatched area outlined by a smooth line
- VFR: No ceiling or ceiling greater than 3,000 feet and visibility greater than 5 miles; not outlined
- Because space is limited, only about half the METAR reports are plotted on the chart
Weather Depiction Chart Knowledge Check


Weather Depiction Chart Conclusion
- For more information, a paper copy of Federal Aviation Administration (FAA-H-8083-28) Aviation Weather Handbook [Amazon] is available for purchase
- A digital copy of Federal Aviation Administration (FAA-H-8083-28) Aviation Weather Handbook is available from the FAA's website
- Always keep yourself current on atmospheric knowledge
- Improve your weather skills with FAA provided (and WINGS credited) resources by going to https://www.faasafety.gov/ and type "weather" into the search bar
- Still looking for something? Continue searching: