Takeoff & Climb Performance
Aircraft takeoff performance is the result of various factors that aid pilots in decision-making throughout the departure.
Introduction to Takeoff & Climb Performance
- Takeoff and climb performance are crucial for a safe departure from an airport and for transitioning to the enroute environment.
- It begins with understanding takeoff performance, where factors such as gross weight, center of gravity, flight profile, and surface condition, to name just a few, can all change the distance required to get airborne.
- How much they affect takeoff performance is determined during pre-flight planning, where pilots consider all relevant factors to calculate performance.
- Lifting off the ground is only the start, as pilots must similarly familiarize themselves with climb performance, such as weight, air density, and winds, to name just a few, that impact the aircraft's safe performance and efficient transition to the enroute environment.
- Practical planning requires calculating climb performance and applying the relevant factors using charts and formulas for real-world flight preparation.
- Pilots flying complex aircraft must also consider constant-speed propeller takeoff and climb characteristics of constant-speed propellers, especially how to manage manifold pressure and RPM during the climb to remain within operating limits.
- Finally, understand published performance differs from realized performance under varying conditions and techniques; a reminder that real-world conditions often differ from ideal test data.
Takeoff & Climb Performance Key Highlights
- Takeoff and climb performance are affected by aircraft weight, atmospheric conditions, runway environment, and pilot technique.
- High density altitude reduces engine power, propeller efficiency, and aerodynamic lift, increasing takeoff distance.
- Aircraft weight directly affects acceleration, climb rate, obstacle clearance capability, and overall performance.
- Headwinds improve takeoff and climb performance, while tailwinds increase runway requirements and reduce climb capability.
- Runway slope, surface conditions, and contamination can significantly affect takeoff roll and aircraft acceleration.
- Published performance data in the Pilot’s Operating Handbook (POH) should be used to calculate expected takeoff and climb performance.
- Best angle of climb speed (Vx) provides maximum altitude gain over a given horizontal distance.
- Best rate of climb speed (Vy) provides the greatest altitude gain over a given period of time.
- Improper aircraft configuration, delayed rotation, or excessive pitch attitudes can degrade climb performance and controllability.
- Effective takeoff and climb planning improves obstacle clearance, operational safety, and aeronautical decision-making.
Takeoff Performance
- Takeoff performance is crucial for a safe departure from an airport.
- Pilots calculate takeoff performance utilizing the Pilot Operating Handbook.
- The minimum takeoff distance is of primary interest in the operation of any aircraft because it defines the runway requirements.
- Aircraft obtain the minimum takeoff distance by taking off at a minimum safe speed that allows a sufficient margin above stall and provides satisfactory control and initial rate of climb.
- Generally, the lift-off speed is some fixed percentage of the stall speed or minimum control speed for the aircraft in the takeoff configuration.
- As such, the lift-off occurs at some particular value of lift coefficient and AOA.
- Depending on the aircraft characteristics, the lift-off speed is anywhere from 1.05 to 1.25 times the stall speed or minimum control speed.
- To obtain the minimum takeoff distance at the specific lift-off speed, the forces that act on the aircraft must provide the maximum acceleration during the takeoff roll.
- The powerplant provides the thrust that produces acceleration, and to minimize takeoff distance, the pilot should maximize thrust output.
- As discussed in Chapter 6, the engine pressure ratio (EPR) is the ratio of exhaust pressure (jet blast) to inlet (static) pressure in a turbojet or turbofan engine. An EPR gauge indicates to the pilot how much power the engines are producing. The higher the EPR, the higher the engine thrust. EPR is used to avoid over-boosting an engine and to set takeoff and go-around power if needed. This information is essential to know before takeoff, as it helps determine the aircraft's performance.
- For the aircraft with a high thrust-to-weight ratio, the increase in takeoff distance might be approximately 21-22%. Still, for the aircraft with a relatively low thrust-to-weight ratio, the increase in takeoff distance would be approximately 25-30%. Such a powerful effect requires proper consideration of gross weight in predicting takeoff distance.
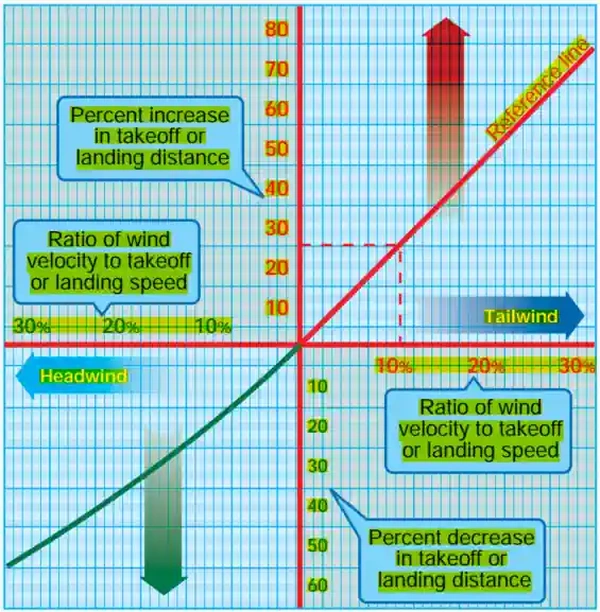
- Wind significantly affects takeoff distance, and pilots must adequately account for it when predicting takeoff performance. The effect of a headwind is to allow the aircraft to reach the lift-off speed at a lower groundspeed, while the effect of a tailwind is to require the aircraft to achieve a greater groundspeed to attain the lift-off speed.
- A headwind that is 10 percent of the takeoff airspeed reduces the takeoff distance approximately 19%. However, a tailwind that is 10 percent of the takeoff airspeed increases the takeoff distance approximately 21%. In the case where the headwind speed is 50% of the takeoff speed, the takeoff distance would be approximately 25% of the zero wind takeoff distance (75% reduction).
- The effect of wind on landing distance is identical to its impact on takeoff distance. Figure 11-19 illustrates the general effect of wind by the percent change in takeoff or landing distance as a function of the ratio of wind velocity to takeoff or landing speed.
- The effect of proper takeoff speed is especially important when runway lengths and takeoff distances are critical. The takeoff speeds specified in the AFM/POH are generally the minimum safe speeds at which the aircraft can become airborne. Any attempt to take off below the recommended speed means that the aircraft could stall, be challenging to control, or have a very low initial ROC. In some cases, an excessive AOA may prevent the aircraft from climbing out of ground effect. On the other hand, an excessive airspeed at takeoff may improve the initial ROC and "feel" of the aircraft but produces an undesirable increase in takeoff distance. Assuming that the acceleration is essentially unaffected, the takeoff distance varies with the square of the takeoff velocity.
- Thus, a ten percent excess airspeed would increase the takeoff distance by 21 percent. In most critical takeoff conditions, such an increase in takeoff distance would be prohibitive, and the pilot must adhere to the recommended takeoff speeds.
- The effect of pressure altitude and ambient temperature is to define the density altitude and its impact on takeoff performance. While subsequent corrections are appropriate for the effect of temperature on certain items of powerplant performance, density altitude defines specific effects on takeoff performance. An increase in density altitude can produce a twofold effect on takeoff performance:
- Greater takeoff speed.
- Decreased thrust and reduced net accelerating force.
- Suppose an aircraft of given weight and configuration operates at greater heights above standard sea level. In that case, the aircraft requires the same dynamic pressure to become airborne at the takeoff lift coefficient. Thus, the aircraft at altitude takes off at the same indicated airspeed (IAS) as at sea level, but because of the reduced air density, the TAS is greater.
- The effect of density altitude on powerplant thrust depends much on the type of powerplant. An increase in altitude above standard sea level brings an immediate decrease in power output for the unsupercharged reciprocating engine. However, an increase in altitude above standard sea level does not cause a reduction in power output for the supercharged reciprocating engine until the altitude exceeds the critical operating altitude. For aircraft powerplants that experience a decay in thrust with increasing altitude, assuming a direct variation with density approximates the effect. The assumed variation closely approximates the effect on aircraft with high thrust-to-weight ratios.
- Accurate accounting of pressure altitude and temperature is essential for predicting takeoff roll distance accurately. The most critical conditions for takeoff performance result from a combination of high gross weight, altitude, temperature, and unfavorable wind. In all cases, the pilot must make an accurate prediction of takeoff distance based on the performance data of the AFM/POH, regardless of the available runway, and strive for a polished and professional takeoff procedure.
- In the prediction of takeoff distance from the AFM/POH data, consider the following:
- Pressure altitude and temperature define the effect of density altitude on distance.
- Gross weight has a significant effect on distance.
- Wind is a significant factor due to the wind component along the runway.
- Runway slope and condition-the effect of an incline and retarding impact of factors such as snow or ice.
-
Factors Impacting Takeoff Performance
- In addition to the essential factors of proper procedures, many other variables affect the takeoff performance of an aircraft.
- Any item that alters the takeoff speed or acceleration rate during the takeoff roll affects the takeoff distance.
- Pilot Operating Handbook/Airplane Flying Manuals include takeoff distance charts that detail the factors impacting takeoff performance.
- Factors include:
- Once calculated, cross-check the required takeoff distance against the available runways to determine what is or is not acceptable.
-
Gross Weight:
- Increasing gross weight can be considered to produce a threefold effect on takeoff performance:
- Higher lift-off speed">#higher-lift-off-speed" title="Higher Lift-Off Speed">Higher lift-off speed.
- Greater mass to accelerate">#greater-mass-to-accelerate">Greater mass to accelerate.
- Increased retarding force (drag and ground friction)">#increased-drag">Increased retarding force (drag and ground friction).
-
Higher Lift-Off Speed:
- A greater gross weight requires a greater lift to overcome, necessitating a higher lift-off speed.
- A 10% increase in takeoff gross weight would cause a 5% increase in takeoff velocity.
-
Greater Mass to Accelerate:
- A greater gross weight requires the powerplant to move more mass, decreases acceleration, and increases takeoff distance.
- A 10% increase in takeoff gross weight would cause at least a 9% decrease in the rate of acceleration.
-
Increased Drag:
- Parasite and induced drag increase as the aircraft travels faster, as does the friction on the ground, the longer the takeoff roll is.
- For example, with ISA conditions, increasing the takeoff weight of the average Cessna 182 from 2,400 pounds to 2,700 pounds (11% increase) results in an increased takeoff distance from 440 feet to 575 feet (23% increase).
- Higher gross weights, therefore, increase takeoff distance and takeoff speed, which in turn increases the time to become airborne and reduces takeoff performance.
- Lower gross weights, therefore, decrease takeoff distance and takeoff speeds, which in turn reduce the time to become airborne and increase takeoff performance.
- Student pilots, in particular, will notice lower gross weights when the instructor is not in the aircraft.
- Increasing gross weight can be considered to produce a threefold effect on takeoff performance:
-
Center of Gravity:
- The farther forward the CG, the longer the takeoff roll, since more authority is required to lift a heavy nose.
- Higher gross takeoff weights require additional authority.
- The opposite is true for farther aft CGs, amplified with lower gross takeoff weights.
- The farther forward the CG, the longer the takeoff roll, since more authority is required to lift a heavy nose.
-
Nose Strut:
- High oil levels reduce the springboard effect, but the change in the shock absorber effect is minimal (strut compression during takeoff).
- The reverse is true if the oil level is low; the springboard effect is essentially normal, but shock absorption is poor.
-
Power Settings:
- Applying power too quickly may cause the aircraft to yaw to the left due to torque, which is most apparent in high-powered engines.
-
Flight Profile:
- The Pilot Operating Handbook/Airplane Flight Manual will specify different configurations and procedures for flying.
-
Flaps:
- Flaps are considered high-lift devices.
- Flaps enable the aircraft to generate more lift during takeoff, facilitating quicker rotation into the ground effect and thereby reducing takeoff distance.
- However, aircraft must accelerate sufficiently in ground effect before continuing a climb.
- When raising flaps, you change the chord line, decreasing the angle of attack (AOA).
- This decrease in AOA causes the aircraft's wing to suddenly generate less lift, requiring a pitch decrease to maintain stall margin during climb.
- Flight profiles for multiengine operations include VMC.
-
Outside Air Temperature:
- Temperature is a key variable (among pressure and humidity) in determining density altitude.
- As temperature rises, so does density altitude.
- Conversely, density altitude drops with temperature.
- Engine performance decreases with higher temperatures.
-
Field Elevation/Density Altitude:
- Higher field elevations correlate to starting at a higher density altitude (even if the density altitude is below the field elevation).
- Recall density altitude is a combination of high altitude, high temperature, and high humidity conditions.
- Higher density altitudes can result in higher engine operating temperatures (they're working harder to obtain performance) and longer takeoff rolls with longer abort rolls when applicable.
- Indications (such as rotation speed) in the aircraft will remain the same, but performance (when that rotation speed is realized) will be degraded.
- In some aircraft, maximum tire speed may also be a factor, as the aircraft needs to move faster to achieve the required performance.
- Consider applying the 70/50 rule for takeoff, which suggests aborting if you haven't reached 70% of your rotation speed by 50% of the runway.
- Higher field elevations correlate to starting at a higher density altitude (even if the density altitude is below the field elevation).
-
Surface Winds:
- The winds impact how air flows over the wing of an aircraft. []
- Headwinds increase the flow of air as the aircraft moves, while tailwinds push against the normal airflow.
- As a result, with a headwind, the airplane already feels some airflow over the wings before it starts to roll, generating lift faster and decreasing the takeoff roll.
- With a tailwind, you would have increased speed, which increases the groundspeed required before sufficient lift is generated for takeoff, resulting in stress on the tire and an increased takeoff distance.
- Tailwind impacts are often far more detrimental than many realize.
- Tailwinds increase the runway distance required for takeoff.
- Tailwinds may decrease directional stability, particularly before the control surfaces have the authority to counteract them.
- Once an aircraft is airborne, the effect of winds changes as the aircraft is moving relative to the airmass, not the ground.
-
Runway Slope:
- Airports are not perfectly flat, and they will have some variance in altitude from one end to the other, especially at large airports.
- Much like when driving a car, moving an airplane uphill requires the engine to work harder to accelerate, which results in a longer time to reach rotation speeds as well as an increased takeoff roll.
- Conversely, downhill takeoffs allow for faster acceleration, resulting in a shorter takeoff roll.
- The FAA publishes airport slope data on the Airport diagram or online at FAA.gov.
- The runway slope is listed only when it is 0.3% or greater.
- On runways less than 8000 feet, publications provide the slope and direction, e.g., 0.3% up NW.
- On runways 8000 feet or greater, publications provide the slope (up or down) on the runway end line, e.g., RWY 13: 0.3% up. RWY 31: Pole. Rgt tfc. 0.4% down.
- Consider adding 10% to your takeoff distance for each percentage of slope.
-
Runway Surface Condition:
- Conditions such as pavement, grass, gravel, water, snow, ice, and rubber slicks impact takeoff performance.
- Runway surfaces are in the Chart Supplement, U.S.
- Consider increasing margins for aborting takeoff to avoid losing control during an abort.
-
Snow, Ice, and Slush:
- Snow, ice, and slushy conditions create a hazardous environment on the runway.
- Consider using soft-field takeoff and landing procedures to minimize the risk of kicking up hazards or losing control.
-
Hydroplaning:
- The risk of hydroplaning increases as the aircraft's speed increases, especially when executing a rejected takeoff procedure.
- The three types of hydroplaning are dynamic">#dynamic-hydroplaning">dynamic, viscous">#viscous-hydroplaning">viscous, and rubber reversion">#rubber-reversion-hydroplaning">rubber reversion.
-
Dynamic Hydroplaning:
- Dynamic hydroplaning occurs when standing water on a wet runway is not displaced from under the tires quickly enough to allow the tire to make contact with the pavement over its entire footprint area.
- The tire rides on a wedge of water under part of the tire surface.
- It can be partial or total hydroplaning, meaning the tire is no longer in contact with the runway surface.
- If the tire breaks contact with the runway, the center of pressure in the tire footprint area could move forward.
- At this point, total spin-down could occur, causing the wheel to stop rotating and resulting in a loss of total braking action.
- The speed at which this happens is the minimum total hydroplaning speed.
-
Viscous Hydroplaning:
- Viscous hydroplaning can cause a complete loss of braking action at lower speeds.
- Smooth runways or contamination, such as films of oil, dust, grease, or rubber, combined with water, create a more viscous (slippery) mixture.
- Viscous hydroplaning can occur with a water depth less than the dynamic hydroplaning threshold, and skidding can occur at lower speeds, such as taxiing during light rain, applying the brakes, or rolling over an oil spill.
- Consider that rubber is found primarily on the approach and departure end of the runway.
-
Rubber Reversion Hydroplaning:
- Rubber reversion hydroplaning is less known, caused by the friction-generated heat that produces superheated steam at high pressure in the tire footprint area.
- The high temperature causes the rubber to revert to its uncured state, forming a seal around the tire area that traps the high-pressure steam.
- Rubber reversion hydroplaning can occur on damp runways or when touchdown occurs on an isolated wet spot of a dry runway, which results in no spin-up of the tires and a reverted rubber skid.
-
Tire Pressure
- Braking effectiveness is a factor of tire pressure.
- Pressure also impacts the speed at which hydroplaning can occur.
- Service the aircraft per the Pilot Operating Handbook.
-
Wind Shear:
- Wind shear is a change in wind speed and direction over a short distance.
- It can occur horizontally or vertically and is most often associated with strong temperature inversions or density gradients.
- Four common sources of low-level wind shear are:
- Frontal activity.
- Thunderstorms.
- Temperature inversions.
- Surface obstructions.
- Read more here.
- If available, utilize information from Low-Level Wind Shear and Microburst Detection Systems.
-
Aircraft Engine Age:
- As aircraft engines age, their power available tends to decrease, resulting in reduced takeoff performance.
-
Inoperative Equipment:
-
Calculating Takeoff Performance
- FAR 91.103 mandates pilots be familiar with all available information concerning that flight, which includes takeoff performance.
- Performance charts are contained in the Pilot Operating Handbook and generally consist of the following: []
-
Determining Normal & Crosswind Takeoff Performance:
-
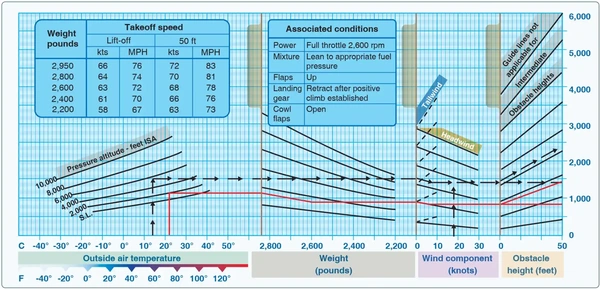
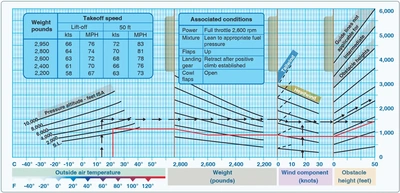
Normal & Crosswind Takeoff Performance Conditions:
- Pressure Altitude: 2,000 feet.
- OAT: 22°C.
- Takeoff Weight: 2,600 pounds.
- Headwind: 6 knots.
- Obstacle Height: 50-foot obstacle.
-
Normal and Crosswind Takeoff Performance Chart:
- From the outside air temperature (at the surface), follow the chart until reaching the airport's pressure altitude.
- From where the OAT intersects the airport's pressure altitude, move right to the beginning of the gross weight section and trace down the lines until intersecting the aircraft's gross takeoff weight.
- Moving straight across, do the same for the headwind or tailwind components.
-
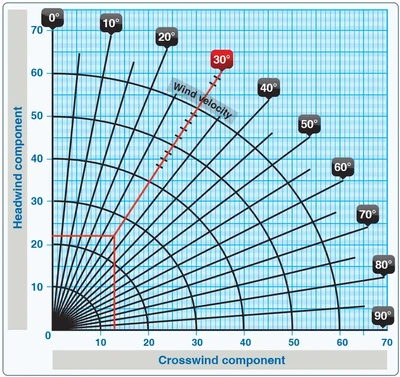
Crosswind Component Conditions:
- Runway: 17 (170°)
- Wind: 140° at 25 knots
-
Crosswind Component Chart:
- The difference between runway and wind direction is 30° (170-140=30) at 25 knots.
- Marking off the 30° point at 25 knots, draw a line straight across and straight down to determine headwind (or tailwind) and crosswind component.
- In this example, the headwind component is 22°, and the crosswind component is 13°.
- While the crosswind component may be relevant to aircraft limitations, crosswind data omissions in the PoH imply that it does not apply to the performance calculation.
- With the head/tailwind component traced (use 6 knots of headwind per original conditions), continue to the right of the chart and complete the same for any obstacles present.
- For the given conditions, this normal takeoff requires ~800 feet of runway with no obstacles and 1,400 feet with obstacles (almost double the distance).
-
-
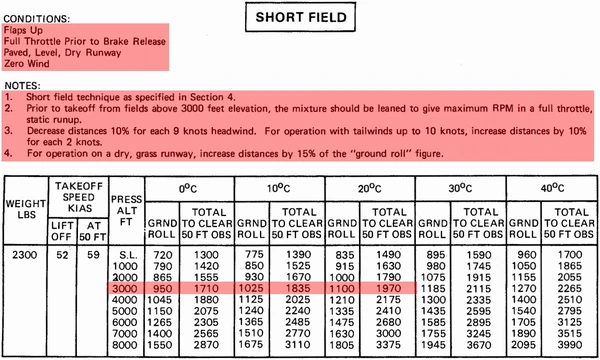
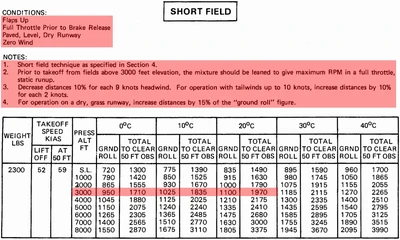
Determining Short-Field Takeoff Performance:
- Use the chart for all performance data specific to an aircraft, in this example, a Cessna 172.
- Typically, there will be more than one chart for the same thing, separated by weight or aircraft configuration conditions.
- Always round up if your weight is not close to the reference weights they provide. Takeoff data will never improve with weight; therefore, your numbers will be more conservative and provide a safety margin.
-
Short-Field Takeoff Performance Conditions:
- Aircraft Weight: 2300lbs.
- Altitude: 3,000' MSL.
- 20°C Outside Air Temperature.
-
Short-Field Takeoff Performance Chart:
[]- Starting at the left with the altitude, continue to the right across the chart until you reach the corresponding temperature.
- We expect a 1,100' takeoff without obstacles and 1,970' with a 50' obstacle.
- With a headwind of 9 knots, we can expect a 990' takeoff without obstacles and a 1,773' takeoff with a 50' obstacle.
- With a tailwind of 4 knots, we can expect a 1,320' takeoff without obstacles and a 2,364' takeoff with a 50' obstacle.
-
Determining Soft-Field Takeoff Performance:
- Calculating soft-field takeoff performance is accomplished using a normal takeoff chart; however, corrections will apply.
- Refer to the notes for the chart and apply the necessary correction.
-
Determining Aborted/Rejected Takeoff Performance:
- Pilots must treat an aborted takeoff, also called a rejected takeoff, as a deliberate procedure.
- Plan and define all decision points before ever walking to the aircraft.
- Every takeoff could potentially result in a rejected takeoff (RTO) for a variety of reasons, including:
- Engine failure.
- Fire or smoke.
- Foreign debris or unsuspected equipment on the runway.
- Bird strikes.
- Blown tires.
- Direct instructions from the governing ATC authority, or recognition of a significant abnormality (split-airspeed indications, activation of a warning horn, etc.).
-
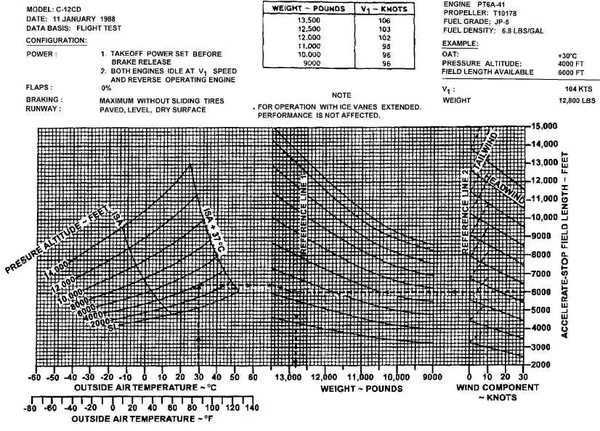
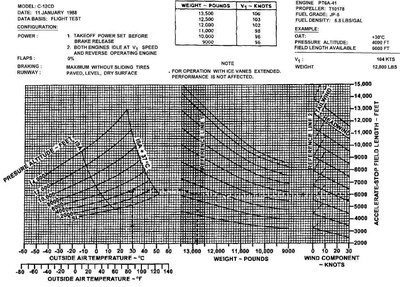
Determining Accelerate-Stop Distance:
- Many aircraft pilot operating handbooks, specifically twin-engine aircraft, publish accelerate-stop distance charts. []
- Accelerate-stop distance is the distance required to accelerate to V1 with all engines at takeoff power, experience an engine failure at V1, and abort the takeoff, bringing the airplane to a stop using braking action only (excluding thrust reversing).
- Pilots must treat an aborted takeoff, also called a rejected takeoff, as a deliberate procedure.


Climb Performance
- For the initial climb, however, we are concerned with our aircraft's performance to escape the ground.
- Climb performance is a measure of excess thrust or power, which generally increases lift to overcome other forces, such as weight and drag.
- Some high-performance aircraft can function like rockets for a limited time, utilizing thrust to lift vertically away from the Earth, requiring no lift.
- Power and thrust are not the same, despite their incorrect use as such.
-
Power vs. Thrust:
- Although the terms power and thrust are sometimes used interchangeably (erroneously implying they are synonymous), distinguishing between the two is important when considering climb performance.
- Power is a measure of output from the engine, while thrust is the force that moves the aircraft.
- In a piston aircraft, power converts to thrust through the propeller.
- In a jet aircraft, the engine directly produces thrust.
- Work is the product of a force moving through a distance and is usually independent of time.
- Power implies work rate or units of work per unit of time, and as such is a function of the speed at which the force is developed.
- Thrust, also a function of work, means the force which imparts a change in the velocity of a mass.
- During takeoff, the aircraft does not stall even though it may be in a climb near the stall speed.
- The aircraft does not stall unless the critical angle of attack is exceeded, even when operating near stall speed
- When moving the throttle controls inside the aircraft, cables control the engine; therefore, controlling engine power output is where the term power levers originates.
- The ability for an aircraft to climb depends upon an excess power or thrust over what it takes to maintain equilibrium.
- Aircraft angles and climb rates are due to the degree of excess power and thrust.
-
Best Angle of Climb vs. Best Rate of Climb:
- Certain conditions will require a specific climb profile, typically characterized by the best rate (Vy) or angle (Vx) of climb.
-
Best Angle-of-Climb:
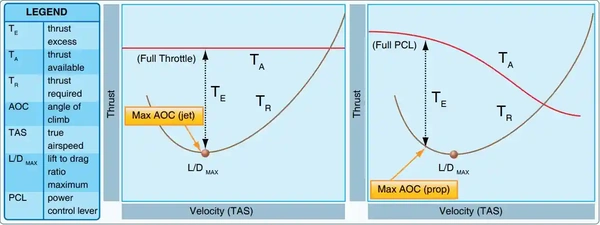
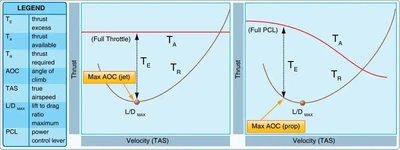
- Max excess thrust results in the best angle of climb.
- The best angle of climb occurs below L/Dmax for a prop but at L/Dmax for a jet []
- It reduces the distance to climb to the same altitude as Vy, but reaches that altitude more slowly.
-
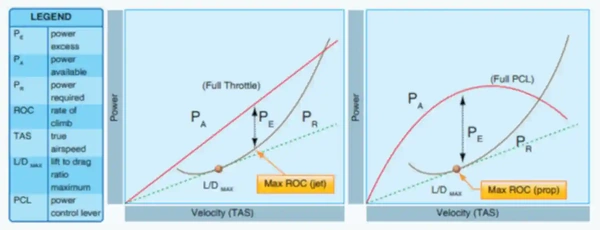
Best Rate-of-Climb:
- The best rate of climb, or Vy, maximizes velocity to obtain the greatest gain in altitude over a given time.
- It is the point where the largest power is available.
- Pilots pitch for Vy when obstacles are not present or when cleared.
- The best rate of climb occurs at L/Dmax for a prop but above L/Dmax for a jet []
- The lower pitch provides more visibility over the cowling.
- Increases airflow over the engine while at high power.
- The best rate provides an additional buffer above stall speeds.
- While Vy takes more distance to reach the same altitude as Vx, it will reach the desired altitude faster than Vx.
-
Propulsion vs. Drag:
- The relationship between propulsion and drag is such that it takes a certain amount of power/thrust to overcome drag, both on the high end (the faster you go) and also on the low end (the slower you go)
- Power/thrust limits are noticeable during slow flight, where you find yourself adding extra power to overcome all the drag increases that are necessary to sustain lift.
- If you fall "behind the power curve," however, you're in a position where you cannot generate immediate performance by simply increasing power.
- The increase in power must first overcome the increased drag; then, the expected performance will occur.
- You can learn more here: https://www.aopa.org/news-and-media/all-news/2013/november/pilot/proficiency-behind-the-power-curve.


Factors Impacting Climb Performance
- Several factors can impact climb performance:
-
Aircraft Weight:
- One of the most fundamental considerations regarding aircraft performance is weight, as it is a principle of flight.
- The higher the weight of an aircraft, the more lift will be required to counteract, resulting in slower climbs and limiting pitch attitudes.
- Climb performance airspeeds are published at the mass gross takeoff weight unless otherwise indicated.
- Vy and Vx decrease by about 1 knot for each 100 pounds below the gross takeoff weight.
-
Temperature:
- Ambient air temperatures impact an aircraft's performance based on its physical properties.
- Engines don't like to run hot; if they do, reducing the throttle settings helps reduce the temperature.
- Temperature is also a leading factor in determining the effect of air density on climb performance.
- Consider utilizing a cruise climb once practical to increase airflow over the engine.
-
Air Density:
- Air density, specifically density altitude, is the altitude at which the aircraft "thinks" it is.
- Performance does not depend on physical altitude, but rather on density altitude; the higher the temperature, the higher the density altitude.
- As the engine and airframe struggle to perform, expect changes in characteristics, such as a reduced climb attitude.
- For each 1,000' increase in density altitude from sea level, Vy will reduce by 1%.
- As a rule of thumb for GA aircraft, Vy decreases by 1 knot of indicated airspeed for each 1,000' increase in density altitude.
- For each 1,000' increase in density altitude from sea level, Vx will increase by 0.5%.
- As a rule of thumb for GA aircraft, Vx increases by 1 knot of indicated airspeed for each 2,000' increase in density altitude.
-
Winds:
- Headwinds increase performance by allowing wind flow over the wings without any forward motion of the aircraft.
- Tailwinds do the opposite.
-
Aircraft Condition:
- Smooth, parasite-free wings produce the best lift.
- Anything that interrupts the smooth flow of air or increases drag will require additional forward movement, or thrust, to overcome.
-
Icing:
- Increased drag will require increased power and, therefore, may decrease climb performance during the climb.
-
Aircraft Engine Age:
- As aircraft engines age, their power available tends to decrease, resulting in reduced climb performance.
-
Aircraft Engine Settings/Profiles Flown:
- The climb phase of flight is flown at high power settings, resulting in increased fuel burn.
- Decreasing power settings reduces fuel burn during the climb, but increases the time and distance required to reach the top of the climb and, consequently, cruising altitudes.
-
Calculating Climb Performance
-
Determining Top-of-Climb:
- Pilots calculate the expected top of climb, or "TOC," to determine time required, fuel consumption, and distance traveled before transitioning to the cruise/enroute phase of flight.
- The TOC calculation is more relevant for cross-country flight planning than for local area operations. []
- For example, given:
- Departure Airport: 900 ft.
- Cruise Altitude: 5,500 ft.
- From Sea Level to 5,500', we calculate 9 minutes, 2.0 Gal, 13 NM.
- Assuming 1,000' for the departure altitude, we calculate: 1 minute, 0.4 Gal, 2 NM.
- Subtract the difference: (9-1)=8 Min, (2.0-0.4)=1.6 Gal, (13-2)=11 NM.
- Pay attention to the notes at the bottom of the chart, especially to add 1.1 Gal for taxi and takeoff.
- To add wind, calculate ground speed and use that distance instead.
- Pilots calculate the expected top of climb, or "TOC," to determine time required, fuel consumption, and distance traveled before transitioning to the cruise/enroute phase of flight.
-
Determining Climb Gradient:
-
Climb Gradient Formula:
- Climb Rate ÷ (Ground Speed (GS) ÷ 60)
Example:
- Ground Speed = 75 knots.
- Climb Rate = 250 feet per minute.
Calculate:
- 250 ÷ (75 ÷ 60) = 200 feet per mile required.
Comments:
- Rate of climb is the altitude gain per unit of time, while climb gradient is the actual measure of altitude gained per 100 feet of horizontal travel, often expressed as a percentage.
- An altitude gain of 1.5 feet per 100 feet of travel (or 15 feet per 1,000 or 150 feet per 10,000) is a climb gradient of 1.5 percent.
-
-
Determining Rate-of-Climb Requirements:
- Used to determine the required rate of climb for a given departure or climbout.
Formula:
- Ground Speed (GS) (knots) ÷ 60 * Climb Gradient (Feet Per Mile).
Example:
- Ground Speed = 75 knots.
- Climb Gradient Required = 200 feet per mile.
Calculate:
- 75 ÷ 60 * 200 = 250 feet per minute climb rate required.
- Used to determine the required rate of climb for a given departure or climbout.


Constant-Speed Propeller Takeoff and Climb Considerations
- As an aircraft with a constant-speed propeller climbs, the manifold pressure decreases.
- Since the RPM is constant, an aircraft can exceed maximum power limitations and become "oversquared."
- Oversquaring occurs when manifold pressure exceeds RPM when comparing inches of mercury to hundreds of RPM.
- For example, RPM is 2500 in a climb, but the manifold pressure is 26" (vs. 25" or lower).
- Pilots must, therefore, decrease throttle position as altitude increases to maintain manifold pressure below hundreds of RPM.
- The Airplane Flight Manual is the guiding document and may suggest an oversquare parameter.
Published versus Realized Performance
- Although general aviation charts found in the POH/AFM do not account for every variable, it is essential to understand the various conditions that may exist.
- If not published, the conditions were likely ideal, with a new engine flown by an experienced test pilot.
- Adding up to a 50% safety margin to any performance number before pushing the performance limits of an aircraft is recommended.
Takeoff & Climb Performance Lessons & Case Studies
Takeoff & Climb Performance Knowledge Check


Takeoff and Climb Performance Conclusion
- Note from the takeoff performance charts that as OAT, aircraft gross weight, tailwind, and obstacle height increase, the required takeoff distance also increases.
- Takeoffs are optional, but landings are mandatory.
- Make decisions early as to whether or not a takeoff under existing conditions is wise.
- POH performance numbers require the same POH technique, which may not be the type of takeoff (normal, short, soft, etc.) that you plan to execute.
- Takeoff distances, as per the book, are performed under test conditions; therefore, applying a margin of safety is recommended.
- Margins should be higher when more variables apply, such as additional baggage or an increased number of passengers.
- Pay attention to winds before takeoff - save tailwinds for cruise.
- Pilots must be familiar with their aircraft's performance as outlined in Federal Aviation Regulations.
- Climb performance is governed by Federal Aviation Regulation Part 23, depending on aircraft weight.
- Pilots may occasionally deviate from climb numbers due to factors such as cooling or the need to locate and follow traffic.
- Remember, when flying under instrument conditions, pilots must meet minimum climb gradients unless they communicate a deviation and receive authorization.
- Check out the AOPA's density altitude quiz.
- Review your seaplane safety knowledge by taking the Air Safety Institute's "Invasive Species" quiz.
- Still looking for something? Continue searching: