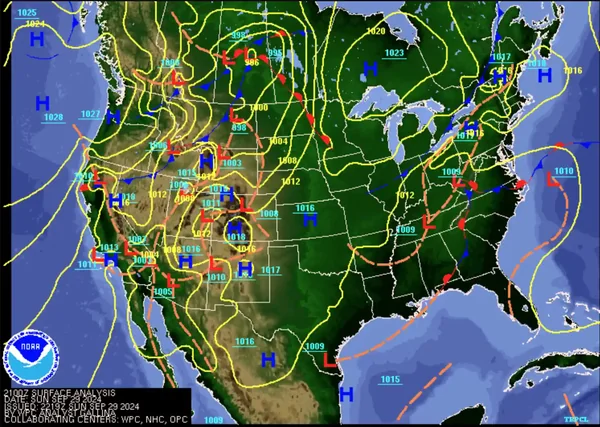
Surface Analysis Chart
Surface Analysis Charts are computer-generated charts with frontal and pressure analysis issued from the Hydro-meteorological Prediction Center.
Introduction to Surface Analysis Chart
- A surface chart (also called surface map or sea level pressure chart) is an analyzed chart of surface weather observations
- Surface Analysis Charts are computer-generated charts with frontal and pressure analysis issued from the Weather Prediction Center (HPC) at https://www.wpc.ncep.noaa.gov/html/sfc2.shtml.
Surface Analysis Chart Key Highlights
- Surface analysis charts provide a graphical depiction of current surface weather conditions and large-scale weather systems.
- Pilots use surface analysis charts to identify fronts, pressure systems, precipitation areas, and overall weather patterns affecting flight operations.
- The charts display high-pressure systems, low-pressure systems, stationary fronts, warm fronts, cold fronts, and occluded fronts.
- Pressure gradients shown on surface analysis charts help pilots anticipate wind strength and general weather movement.
- Surface weather patterns influence visibility, turbulence, precipitation, cloud development, and convective activity.
- Pilots should evaluate frontal movement and pressure trends when planning routes, alternates, and fuel requirements.
- Surface analysis charts combine weather observations from multiple reporting stations into a unified weather overview.
- Weather systems shown on the charts may evolve rapidly, requiring pilots to obtain updated weather information before and during flight.
- Surface analysis charts are commonly used with radar imagery, prognostic charts, METARs, and weather advisories for comprehensive weather planning.
- Understanding surface analysis charts improves weather interpretation, strategic planning, and overall flight safety.
Surface Analysis Charts
- Surface Analysis Charts provide a snapshot for regional/cross-country flights, providing: []
- An isobaric (lines of equal pressusure are isobars) analysis showing identifiable, organized pressure patterns.
- Also includes the positions of highs, lows, ridges, and troughs, and the location and character of fronts and various boundaries, such as drylines, outflow boundaries, and sea breeze fronts.
- A variety of charts are created for various regions that provide varying number of overlays
- Additionally, they provide a look across the country as to where weather patterns are located and how they have developed

Issuance & Validity
- Issued eight times daily (0000Z, 0300Z, 0600Z, 0900Z, 1200Z, 1500Z, 1800Z, 2100Z)
- Valid Time (VT) of the chart on the lower left corresponds to the time of the observations
- Valid time is given in UTC
- Information is about 2-3 hours old
- Information is all observed data
Isobars
- Isobars are drawn as solid lines in order to represent pressure
- Each interval is spaced at 4 millibars (mb)
- hectoPascals (hPa) are the metric equivalent of millibars
- Gradient, or pressure gradient force, is measured by how far apart the isobars are from one another
- When the pressure gradient is very shallow, intermediate isobars (short dashed lines) are sometimes drawn at one-half the standard interval
Pressure Systems
- The letter "L" denotes low pressure.
- The letter "H" denotes high pressure.
- The pressure center of each is indicated by a three or four digit number that is the central pressure in mb (hPa)
Fronts
- Shows positions and types of fronts
- A three-digit number near a front classifies it as to type, intensity, and character enclosed in brackets ([ or ])
- An expanded explanation of each front can be found at https://www.wpc.ncep.noaa.gov/html/fntcodes2.shtml.
Troughs & Ridges
- A trough of low pressure with significant weather will be depicted as a thick, dashed line running through the center of the trough and identified with the word "TROF"
- The symbol for a ridge of high pressure is very rarely, if at all, depicted
Notes
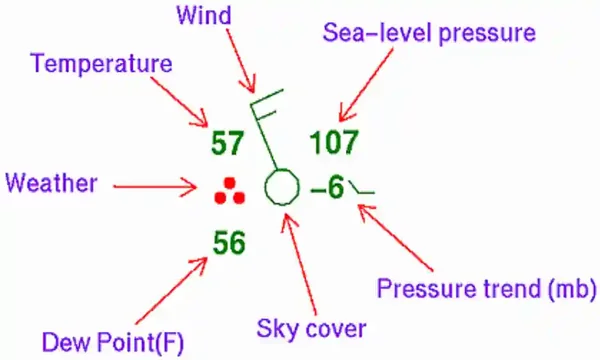
- The observations from various stations are plotted
- These are referred to as station models
- Round station symbols indicate observations taken by an observer
- Square station symbols indicate the sky cover was determined by an automated machine
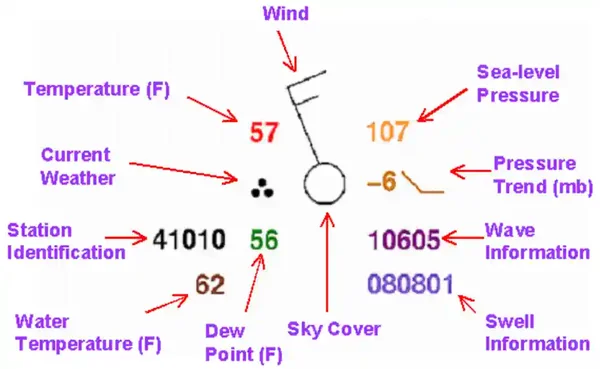
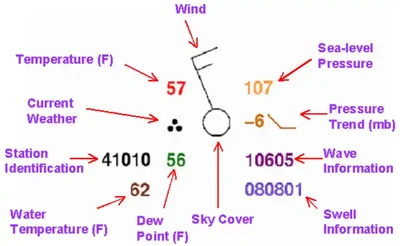
- Models appearing over water are data from ships, buoys, and offshore oil platforms
- An outflow boundary will be depicted as a thick, dashed line with the word "OUTBNDY"
- A dry line will be depicted as a line with unshaded pips or a through symbol identified with the words "DRY LINE"
- Pressure is plotted in tenths of millibars, with the leading 10 or 9 omitted
- A legend is printed on each chart stating is name, valid date, and valid time
Frontal & Pressure Markings
-
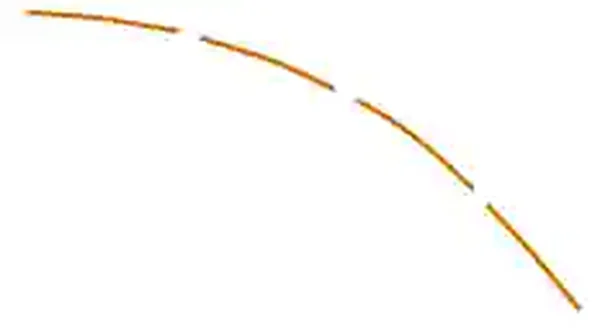
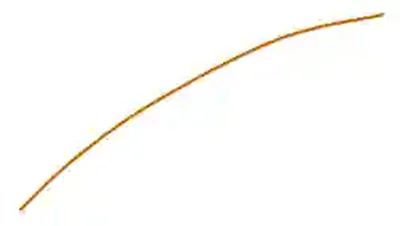
Trough:
- An elongated area of relatively low atmospheric pressure; the opposite of a ridge. []
- On HPC's surface analyses, this feature is also used to depict outflow boundaries
-
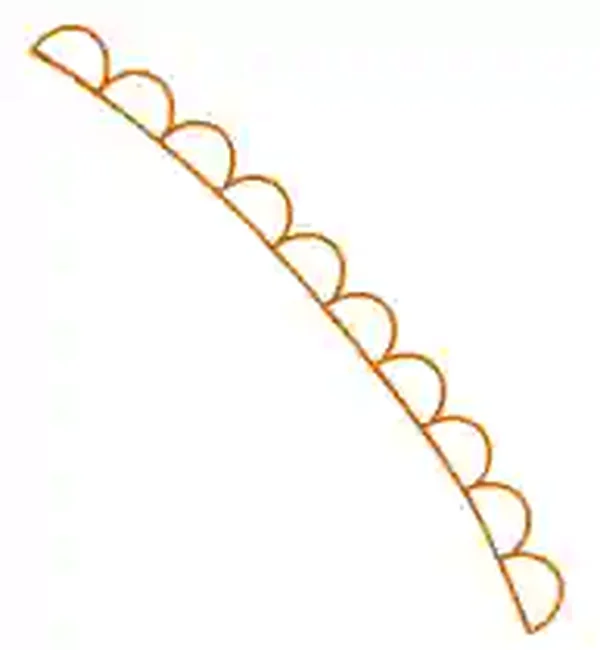
Dry Line:
- A boundary separating moist and dry air masses. []
- It typically lies north-south across the central and southern high Plains states during the spring and early summer, where it separates moist air from the Gulf of Mexico (to the east) and dry desert air from the southwestern states (to the west)
-
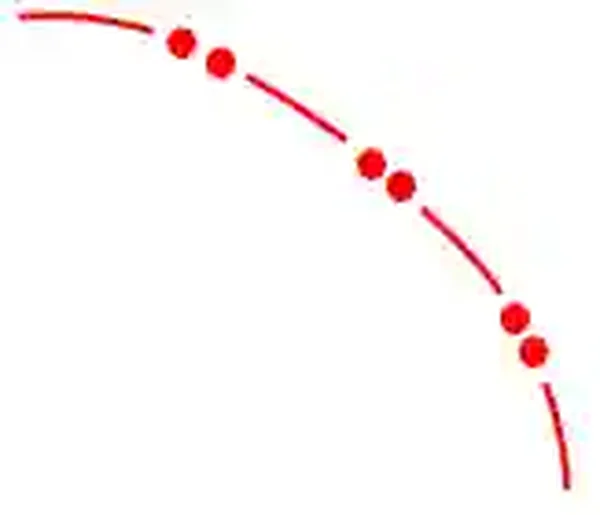
Squall Line:
- a line of active thunderstorms, either continuous or with breaks, including contiguous precipitation areas resulting from the existence of the thunderstorms. []
-
Tropical Wave:
- A trough or cyclonic curvature maximum in the trade wind easterlies. []
-
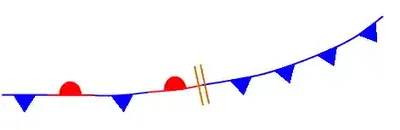
Frontal Change:
- A hash mark denotes a change in frontal type. []
- The hash mark will always be drawn perpendicular to the boundaries
- They are not drawn at "triple points" (the intersection of an occluded, cold and warm or stationary front) and where a low pressure center separates the different frontal types
-
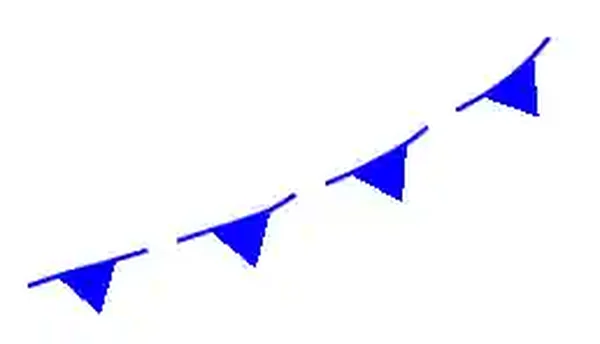
Frontogensis:
- Refers to the initial formation of a surface front or frontal zone. []
- Depicted on HPC's surface analysis and forecast charts as a dashed line with the graphical representation of the developing frontal type (the blue triangle for cold fronts, the red semicircle for warm fronts, etc...) drawn on each segment
-
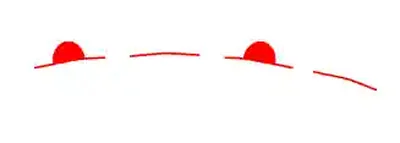
Frontolysis:
- the dissipation or weakening of a front. []
- depicted as a dashed line with the graphical representation of the weakening frontal type drawn on every other segment


Station & Ship/Buoy Plot Models
- Regional surface analysis chart products provide station plot models [/]
- Land, ship, buoy, and C-MAN stations are plotted on the chart to aid in analyzing and interpreting the surface weather features.
- These plotted observations are referred to as station models.
- Some stations may not be plotted due to space limitations; however, all reporting stations are used in the analysis.

Surface Analysis Chart Knowledge Check
Private Pilot

Core Knowledge Review
Review the foundational knowledge, key concepts, and practical considerations for Surface Analysis Chart.
Foundational
Immediate Feedback
Answer Explanations
Commercial Pilot

Advanced Application
Apply your knowledge of Surface Analysis Chart to advanced operational scenarios, risk management, and aeronautical decision-making.
Advanced
Scenario Based
Risk Management
Why Take a Quiz?
Quizzes reinforce key concepts, identify knowledge gaps, and build confidence for real-world decisions in the cockpit.
Surface Analysis Chart Conclusion
- For more information, a paper copy of Federal Aviation Administration (FAA-H-8083-28) Aviation Weather Handbook [Amazon] is available for purchase
- A digital copy of Federal Aviation Administration (FAA-H-8083-28) Aviation Weather Handbook is available from the FAA's website
- Improve your weather skills with FAA provided (and WINGS credited) resources by going to https://www.faasafety.gov/ and type "weather" into the search bar
- Still looking for something? Continue searching: