Winds & Temperatures Aloft
Learn how to read and decode winds and temperatures aloft forecasts, including wind direction, speed, temperatures, and forecast periods.
Introduction to Winds & Temperatures Aloft
- Winds and temperatures aloft are computer-prepared forecasts that describe the expected wind direction, wind speed, and temperature at specified altitudes, locations, and times.
- Pilots use these forecasts for flight planning and execution, including selecting cruising altitudes, calculating wind corrections and groundspeed, and estimating flight time and fuel requirements.
- Forecasts are available as coded text and graphical displays.
- Understanding their issuance and validity helps pilots select information appropriate to the planned flight.
- Reading the forecast elements requires recognizing altitude references, wind and temperature codes, and graphical symbols.
- When a planned route or altitude falls between published forecast locations or levels, interpolation helps estimate the conditions along the flight.
- Reinforce your understanding of Winds & Temperatures Aloft by completing the knowledge quiz and interactive scenario, comparing your performance with the applicable Airman Certification Standards, and reviewing the topic summary before moving on.
Winds & Temperatures Aloft Key Highlights
- Winds and temperatures aloft forecasts provide wind direction, wind speed, and temperature predictions at selected altitudes.
- Pilots use winds aloft data to calculate headings, groundspeed, fuel burn, and estimated time en route and assess aircraft performance.
- Forecast wind direction is reported in degrees true, while wind speed is reported in knots.
- Temperatures aloft help pilots evaluate aircraft performance, icing potential, and high-altitude operating conditions.
- Winds aloft forecasts support route planning by helping pilots identify favorable tailwinds or avoid strong headwinds.
- Significant wind changes with altitude may indicate wind shear, turbulence, or changing weather patterns.
- Pilots should compare forecast winds aloft with actual groundspeed, weather reports, and updated forecast products during flight.
- Forecast data is issued for specific reporting locations and altitude levels, requiring interpolation for routes between stations.
- Accurate interpretation of coded winds and temperatures aloft improves fuel planning, navigation accuracy, and operational efficiency.
- Understanding winds and temperatures aloft improves weather analysis, flight planning, and overall aeronautical decision-making.
Winds & Temperatures Aloft Purpose
- There is no single official wind and temperature aloft model for flight planning.
- Flight-planning applications may obtain forecasts directly from different computer models; update cycles, forecast intervals, altitude levels, terrain detail, and horizontal spacing vary by model.
- Pilots need to know how to read winds and temperatures aloft charts and graphics to aid in planning.
- While cross-country flight planning and execution are primary reasons pilots look at winds and temperatures aloft, these reports can also apply to local flights.
- Specifically, winds & temperatures aloft forecasts aid pilots in:
- Determining the most favorable altitude based on winds and the direction of flight.
- Calculating aircraft performance, including fuel consumption and flight time.
- Identifying areas of possible aircraft icing by noting air temperature of +2°C to -20°C, and temperature inversions.
- Predicting turbulence by observing abrupt changes in wind direction and speed at different altitudes.
Winds & Temperatures Aloft Issuance & Validity
-
Winds & Temperatures Aloft Issuance:
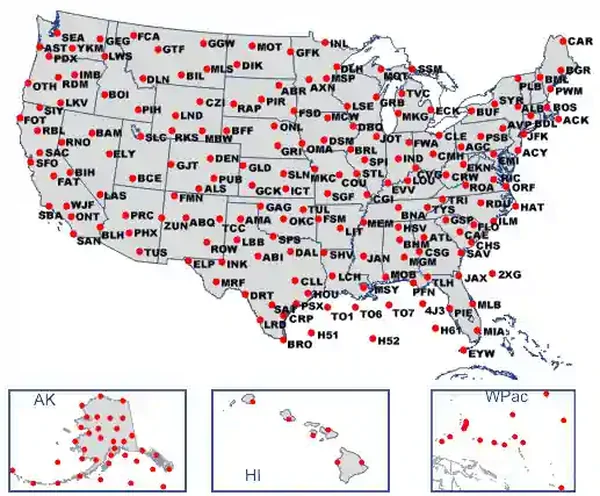
- Winds and temperatures aloft are issued in textual and graphical formats, covering nine regions: six within the contiguous United States (CONUS) and three outside it (OCONUS): []
- Winds & temperatures aloft (FB) forecasts are produced by the NWS National Centers for Environmental Prediction (NCEP).
-
Textual Winds & Temperatures Aloft:
- FB charts are issued four times daily (every six hours), valid for the time stated on the winds aloft chart.
-
Graphical Winds & Temperatures Aloft:
- NWS' Rapid Refresh model winds are updated every hour.
- The FAA handbook describes Rapid Refresh model values at grid points separated by as little as 9 statute miles (SM); spacing varies among models and should not be assumed for every graphical product.
-
Winds & Temperatures Aloft Validity:
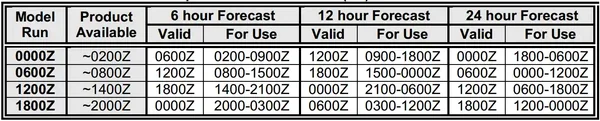
- FB forecasts are produced from 0000, 0600, 1200, and 1800 UTC model cycles, with 6-, 12-, and 24-hour forecasts. Product availability follows the model run; select the bulletin whose printed use window covers the planned flight.
- Amendments are not issued to the legacy FB forecasts. []
- FB forecasts are refreshed four times daily; changes between scheduled updates may not appear for up to six hours. Check the model base time and use window rather than treating six hours as a universal maximum data age.
- If the scheduled forecast is delayed, the existing valid forecast based on the earlier 6-hourly data can be used until a new forecast is transmitted.
Winds & Temperatures Aloft Forecast Elements
- Pilots can locate textual reports on the Aviation Weather Center Website under the "Products"/"Wind/temp data" drop-down.
- Textual and graphical formats are available.
-
Textual Winds & Temperatures Elements:
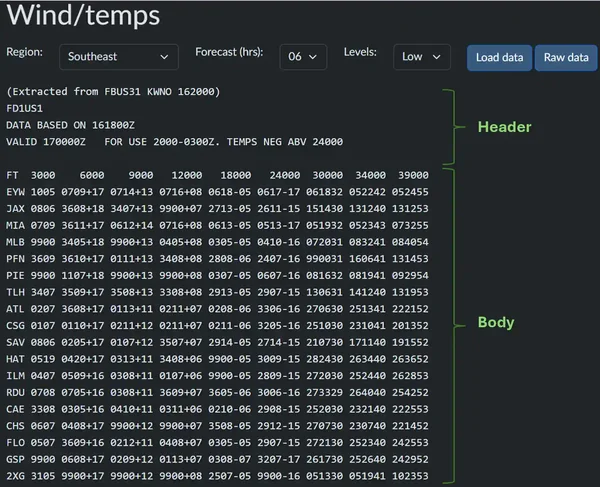
- Textual Wind and Temperature Aloft forecasts consist of two elements: the header and the forecasted data chart. []
-
Textual FB Header:
- "FD" indicates a wind and temperatures aloft forecast.
- FD1US1 identifies the 6-hour contiguous United States bulletin for levels through 39,000 feet. Bulletin identifiers vary with the region, forecast period, and altitude group; for example, the corresponding Alaska identifier is FD1AK1.
- The header distinguishes the model base time, forecast valid time, and use window. Times are in Coordinated Universal Time (UTC), indicated by Z.
- DATA BASED ON 131800Z: The model base time is 1800 UTC on the 13th; this is not the forecast valid time.
- VALID 140000Z: The forecast is valid at 0000 UTC on the 14th.
- Use the forecast during the "FOR USE" period listed.
- FOR USE 2000-0300Z: In this example, use the forecast from 2000 UTC on the 13th through 0300 UTC on the 14th. The date changes at midnight; read this window together with the base and valid dates.
- "TEMPS NEG ABOVE 24000" is a standard line.
- Since temperatures above 24,000' are always negative, reports omit the negative ("-") sign.
-
Textual FB Forecasted Data (body):
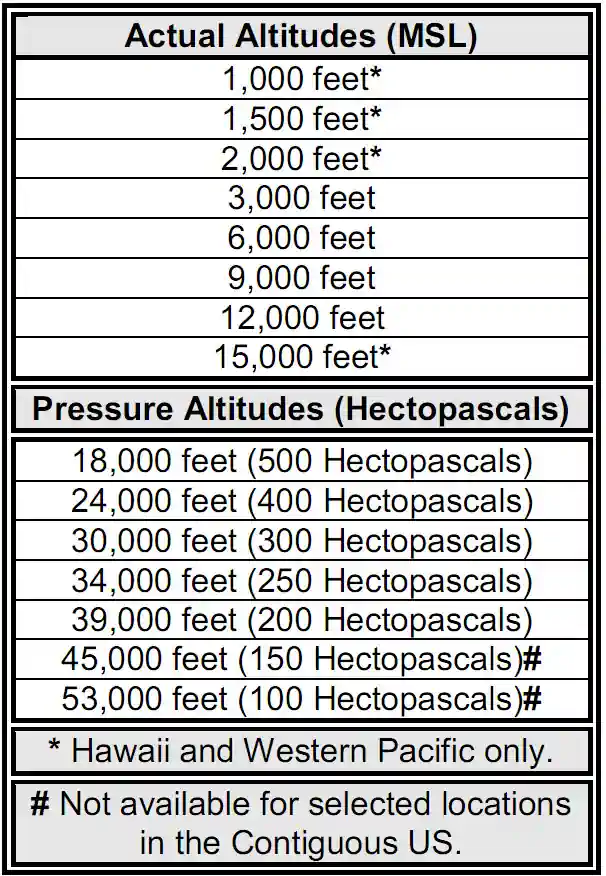
- The standard lower-altitude bulletin provides wind data at 3,000, 6,000, 9,000, 12,000, 18,000, 24,000, 30,000, 34,000, and 39,000 feet, with temperatures where provided.
- Hawaii and Pacific bulletins add 1,000, 1,500, 2,000, and 15,000-foot levels.
- Separate high-altitude bulletins include 45,000 and 53,000 feet for selected locations. Hawaii/Pacific bulletins are divided above 24,000 feet rather than above 39,000 feet.
- "FT" indicates the levels of the wind and temperature data.
- In the four-digit wind group, the first two digits indicate wind direction in tens of degrees, and the last two indicate wind speed in knots.
- Forecast levels up to and including 15,000 feet are true altitudes referenced to mean sea level (MSL).
- Forecast levels at or above 18,000 feet are pressure altitudes expressed as flight levels (FL).
- The symbolic form of the forecasts is DDff+TT, in which:
- DD is the wind direction code in tens of degrees true.
- ff is the wind speed in knots.
- TT is the temperature in degrees Celsius.
-
Forecasted Winds Aloft:
- The wind group is normally omitted when the forecast altitude is within 1,500 feet of the station elevation. The National Weather Service (NWS) makes an exception for the additional Hawaii/Pacific levels listed above.
- Wind direction is reported in tens of degrees true using two digits, followed by two digits for wind speed in knots.
- Example: 2022
- Direction: Multiply 20 by 10: 20 × 10 = 200° true.
- Speed: The final two digits, 22, indicate 22 knots.
- Result: Wind from 200° true at 22 knots.
- Example: 2022
- When forecast wind speeds are less than 5 knots, the wind group is coded 9900, meaning “light and variable.”
- 9900+12: Winds are light and variable, temperature +12°C. Above 24,000 feet, 990012 instead means light and variable winds with a temperature of −12°C.
- For wind groups other than 9900, a direction code greater than 36 indicates the high-speed rule, which applies starting at 100 knots. Subtract 50 from the direction code and add 100 to the speed code:
- Example: 731960
- Direction: Subtract 50 from 73, then multiply by 10: (73 − 50) × 10 = 230° true.
- Speed: Add 100 to 19: 19 + 100 = 119 knots.
- Temperature: The final two digits, 60, indicate −60°C; the negative sign is omitted above 24,000 feet.
- Result: Wind from 230° true at 119 knots, with a temperature of −60°C.
- Example: 731960
- Forecast wind speeds of 200 knots or greater are encoded as 199 knots:
- Example: 689960
- Direction: Subtract 50 from 68, then multiply by 10: (68 − 50) × 10 = 180° true.
- Speed: Add 100 to 99: 99 + 100 = 199 knots, indicating 199 knots or greater.
- Temperature: The final two digits, 60, indicate −60°C; the negative sign is omitted above 24,000 feet.
- Result: Wind from 180° true at 199 knots or greater, with a temperature of −60°C.
- Example: 689960
-
Forecasted Temperatures Aloft:
- The temperature is omitted when the forecast altitude is within 2,500 feet of the station elevation.
- No temperature is provided in the standard 3,000-foot group, even when the station-elevation restriction would permit it. A blank group means data is not provided, not calm winds or zero temperature.
- Temperature follows the four-digit wind group in degrees Celsius. Include the + or − sign through 24,000 feet; above 24,000 feet the negative sign is omitted.
- Example: 192832
- Temperature: The final two digits, 32, indicate −32°C; the negative sign is omitted above 24,000 feet.
- Example: 192832
- The standard lower-altitude bulletin provides wind data at 3,000, 6,000, 9,000, 12,000, 18,000, 24,000, 30,000, 34,000, and 39,000 feet, with temperatures where provided.
-
Graphical Winds & Temperatures Aloft Reports:
- Pilots can locate graphical winds and temperatures aloft forecasts on the Aviation Weather Center's Website under the "Weather/Winds/Temperatures" drop-down. []
- The graphical chart allows pilots to show or hide individual layers.
- Pilots can select the desired altitude to view forecast data for that level.
- Use the time slider to select the forecast valid time. Graphical Forecasts for Aviation (GFA) includes hourly model forecasts; available intervals and forecast ranges depend on the selected product.
-
Graphical Forecasted Winds Aloft:
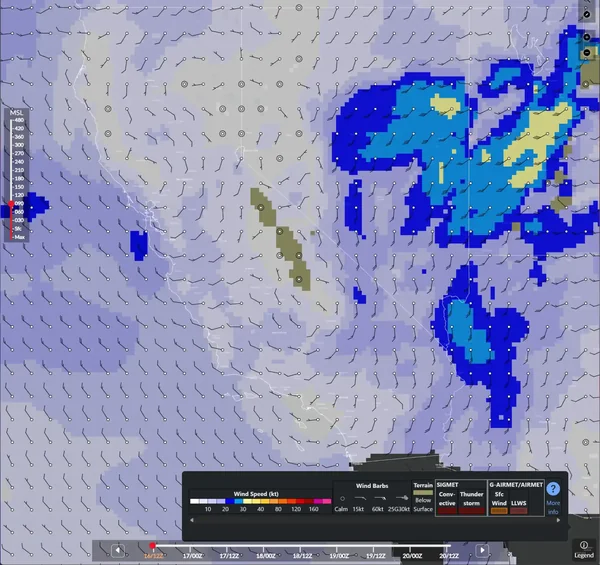
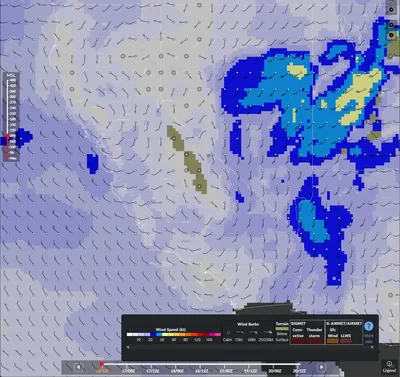
- Wind data displays with a wind flag and a "heat map." [/]
- When viewing winds, the heat map colors represent wind speed, not temperature.
-
Interpreting Wind Flags:
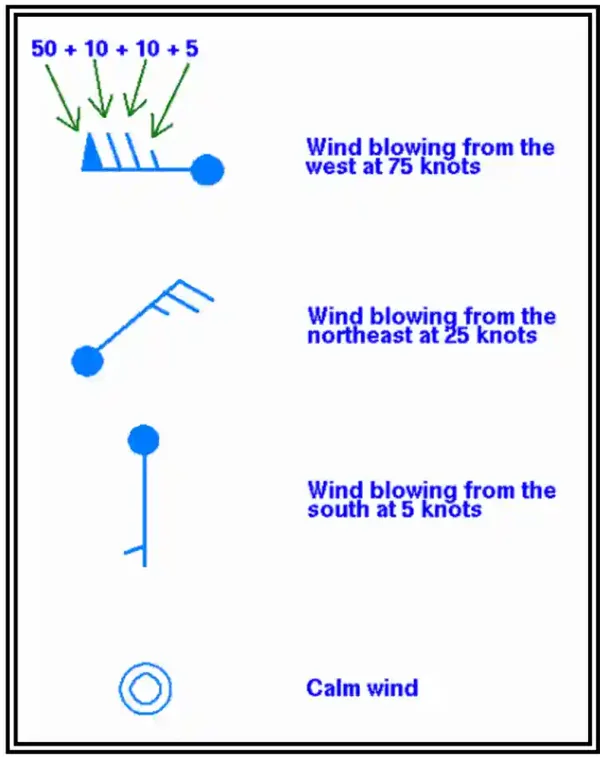
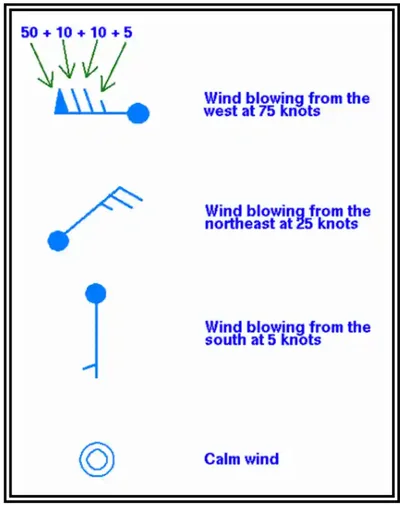
- A point depicts stations from which a line extends.
- The line represents the direction of the wind (i.e., follow the line down to the station for direction).
- At the end of the line are barbs with a short line indicating 5 knots, a longer line indicating 10 knots, and a triangle indicating 50 knots.
- Wind barbs are additive, so two long lines indicate 20 knots.
- If no flag is present, winds are calm (less than 5 knots).
- Forecast gusts appear at the end of the wind flag, marked by the letter G and the gust speed in knots.
-
Interpreting Wind Speeds:
- A heat map overlay provides wind speed data at a glance, especially over vast areas.
- The brighter the color, the higher the wind speed.
- Terrain is displayed where its elevation is higher than the selected altitude.
- Clicking on a station displays its forecast wind direction and speed.
- GFA also offers a low-altitude mode with levels below 3,000 feet. These levels use above ground level (AGL); check the selected product and altitude reference rather than assuming every graphical level is mean sea level.
-
Graphical Forecasted Temperatures Aloft:
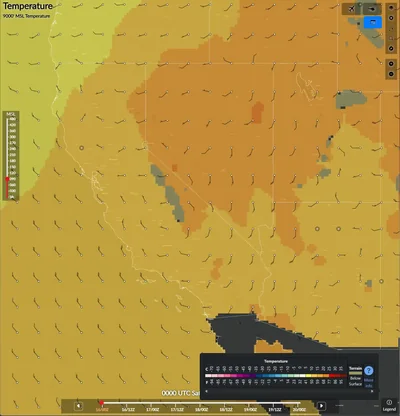
- Temperature data is displayed on a color map, with a legend in the bottom-right corner of the web tool. []
- Use the color legend to interpret the displayed temperatures.
- Wind data displays with a wind flag and a "heat map." [/]

Interpolating Winds and Temperatures Aloft
- When the route or cruising altitude falls between published locations or levels, interpolate to estimate the conditions. Use forecasts appropriate to the flight time.
- Training example between altitudes: At Station A, winds are 240° true at 20 knots and +6°C at 6,000 feet, and 240° true at 40 knots and 0°C at 9,000 feet. Halfway between, at 7,500 feet, estimate 240° true at 30 knots and +3°C.
- Training example between locations: At 7,500 feet, Station A’s estimated conditions are 240° true at 30 knots and +3°C. Station B forecasts 240° true at 40 knots and +1°C for the same altitude and time.
- Halfway between the stations, estimate 240° true at 35 knots and +2°C.
- These examples use a constant wind direction to demonstrate interpolation. When directions differ, account for wind as a vector; do not directly average directions that straddle north.
- Use the estimated wind with the planned true course and aircraft true airspeed to calculate wind correction, groundspeed, flight time, and fuel requirements.
- Compare the forecast with actual conditions during flight; interpolation may not capture local terrain effects or abrupt changes.
Winds & Temperatures Aloft Interactive Scenario
The Forecast That Changed the Winds and Temperatures Aloft Plan
Follow one developing flight from briefing through debrief. Each decision applies Winds and Temperatures Aloft knowledge to changing conditions, workload, and operational risk.
Scenario Complete
Winds & Temperatures Aloft Knowledge Check
Choose the knowledge check that matches your current training for Winds & Temperatures Aloft.
 Private Pilot
PPL knowledge check
Core Knowledge Review
Review foundational knowledge, key concepts, and practical considerations. Topic: Winds & Temperatures Aloft.
- Immediate feedback
- Answer explanations
- Account progress tracking
 Commercial Pilot
CPL knowledge check
Advanced Application
Apply knowledge to advanced operations, risk management, and aeronautical decision-making. Topic: Winds & Temperatures Aloft.
- Immediate feedback
- Answer explanations
- Account progress tracking
 Instrument Rating (Airplane)
Instrument knowledge check
Instrument Knowledge
Practice the procedures, systems, weather, and decisions used in instrument flight. Topic: Winds & Temperatures Aloft.
- Immediate feedback
- Answer explanations
- Account progress tracking
 Instrument Instructor
CFII knowledge check
Instrument Instructor Knowledge
Review instrument knowledge at the depth expected of an instrument flight instructor. Topic: Winds & Temperatures Aloft.
- Immediate feedback
- Answer explanations
- Account progress tracking
Why Take a Quiz?
Quizzes reinforce key concepts, identify knowledge gaps, and build confidence for real-world decisions. Quiz material is representative of the information provided here and is not based on or sourced from the Federal Aviation Administration test bank.
Winds & Temperatures Aloft Conclusion
- Winds and temperatures aloft are forecasts, not observations.
- Do not confuse the term heat map with temperature: when viewing winds, the colors represent wind speed, not temperature.
- Winds and temperatures aloft forecasts provide a concise overview of expected conditions across multiple locations and altitudes.
- Pilots should understand how to read winds and temperatures aloft forecasts, primarily for longer-distance flight planning and, when relevant, for local flights.
- For more information, a paper copy of the Federal Aviation Administration (FAA-H-8083-28) Aviation Weather Handbook [Amazon] is available for purchase.
- A digital copy of the Federal Aviation Administration (FAA-H-8083-28) Aviation Weather Handbook is available from the FAA's website.
- Textual reports provide a simple, low-bandwidth format, while graphical reports help pilots visualize conditions across wide areas.
- Winds and temperatures aloft can change during a forecast’s validity period.
- Consider cross-checking wind readings with the Velocity Azimuth Display (VAD) winds.
- Winds and temperatures are not forecasted within 1500 and 2500 feet, respectively, meaning these blocks will appear blank for some stations in mountainous areas.
- Explore the aircraft icing and atmosphere pages to learn more about applying winds and temperatures aloft information.
- Improve your weather skills with FAA-provided (and WINGS-credited) resources by going to https://www.faasafety.gov/ and typing "weather" into the search bar.
- Still looking for something? Continue searching:
Winds and Temperatures Aloft References
- FAA Aviation Weather Handbook, Chapter 27, Winds and Temperatures Aloft.
- National Weather Service Instruction 10-812, Aviation Wind and Temperature Aloft Forecasts.
- Aviation Weather Center, Graphical Forecasts for Aviation Help.
- Aeronautical Information Manual, Preflight Briefing.
- Federal Aviation Administration (FAA-H-8083-28) Aviation Weather Handbook.
- Federal Aviation Administration - Pilot/Controller Glossary.
- National Weather Service (NWS) National Centers for Environmental Prediction (NCEP).
- North American Mesoscale (NAM).
- Wikipedia - Inversions.
- World Meteorological Organization (WMO).